Figure 5.
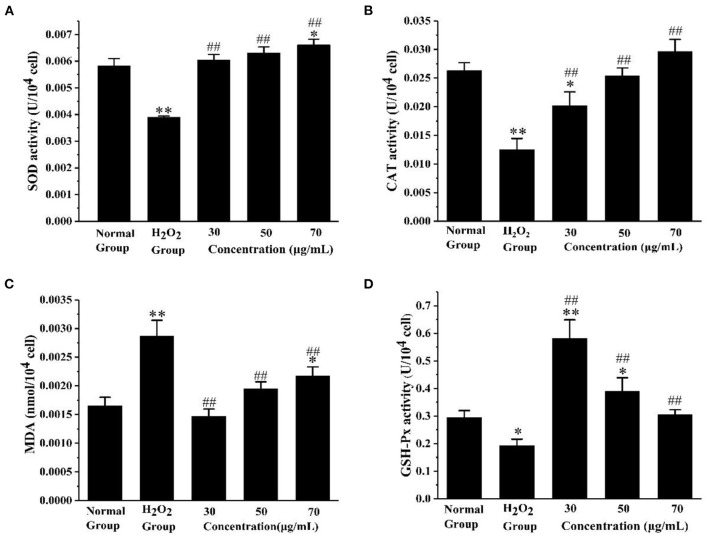
Evaluation of antioxidant enzyme activity and lipid peroxidation. (A) The effect of AS on the activity of SOD. (B) The effect of AS on the activity of CAT. (C) The effect of AS on the cellular concentration of MDA. (D) The effect of AS on the activity of GSH-Px. The results were expressed as the mean ± SE of three independent experiments. *P < 0.05 compared with the normal cell group, **P < 0.01 compared with the normal cell group. ##P < 0.01 compared with H2O2, ANOVA analyses (Supplementary Table 5).

