
FIGURE 3.
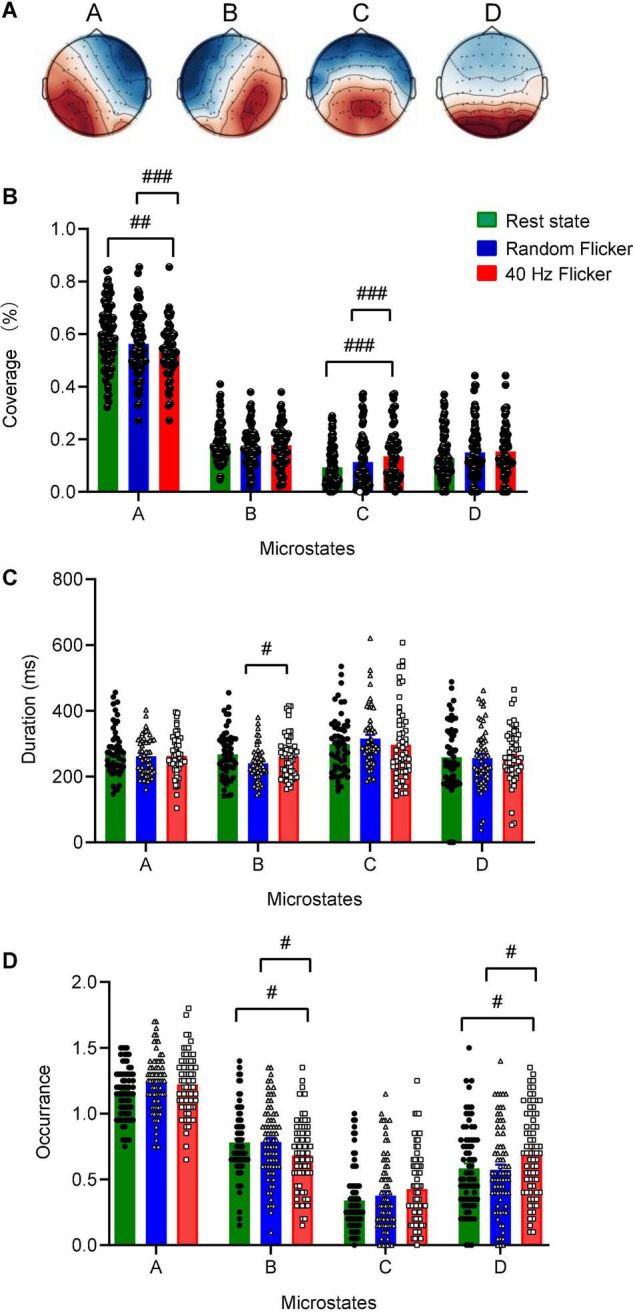
Identification of microstate classes, coverage, duration, occurrence. Panel (A) The global maps were calculated based the aggregated dataset from all participants and were back-fitted to each of the EEG recordings. The labels (A–D) indicate the four microstate classes. The four microstate classes coverage (B), duration (C), and occurrence (D) were calculated and shown. Statistical comparisons between the three conditions (rest state, random flicker, and the 40 Hz light stimulation) were performed using one-way ANOVA with multiple comparisons using FDR correction using the two-stage linear step-up procedure of Benjamini, Krieger, and Yekutieli using GraphPad. Significant groups were shown in panel (B–D). #, ##, and ### indicate the FDR adjusted P < 0.05, P < 0.01, and P < 0.001, respectively. Error bars are S.E.M.