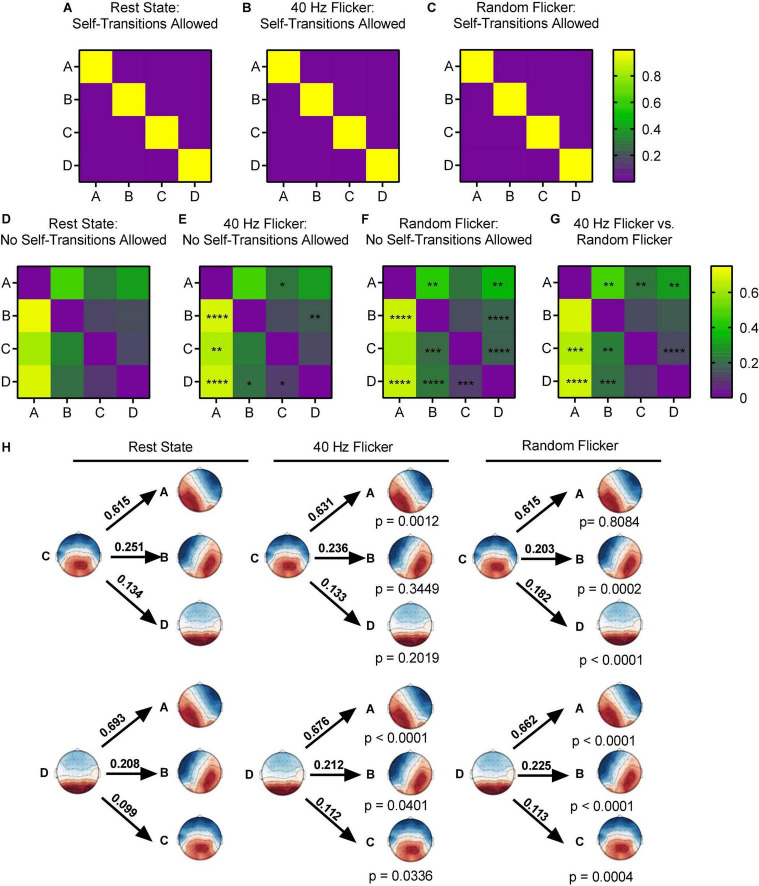
FIGURE 4.
Microstate transition syntax analysis in different conditions. Panels (A–G), each map displays Markov chain analysis result for one of the four microstate classes. (A–C) Self-transition allowed tests, and (D–G) for self-transition not allowed tests. Panel (H) shows a schematic view of the syntax pattern to indicate transition from C and D to other states in the rest state (left), 40 Hz flicker (middle), and random flicker (right). A one-way ANOVA with Tukey post hoc multiple comparison test was used to identify significant groups. *, **, ***, and **** indicated the Tukey adjusted P < 0.05, P < 0.01, P < 0.001, and P < 0.0001, respectively. Scale bars represent the probability (Prob).

