
FIGURE 5.
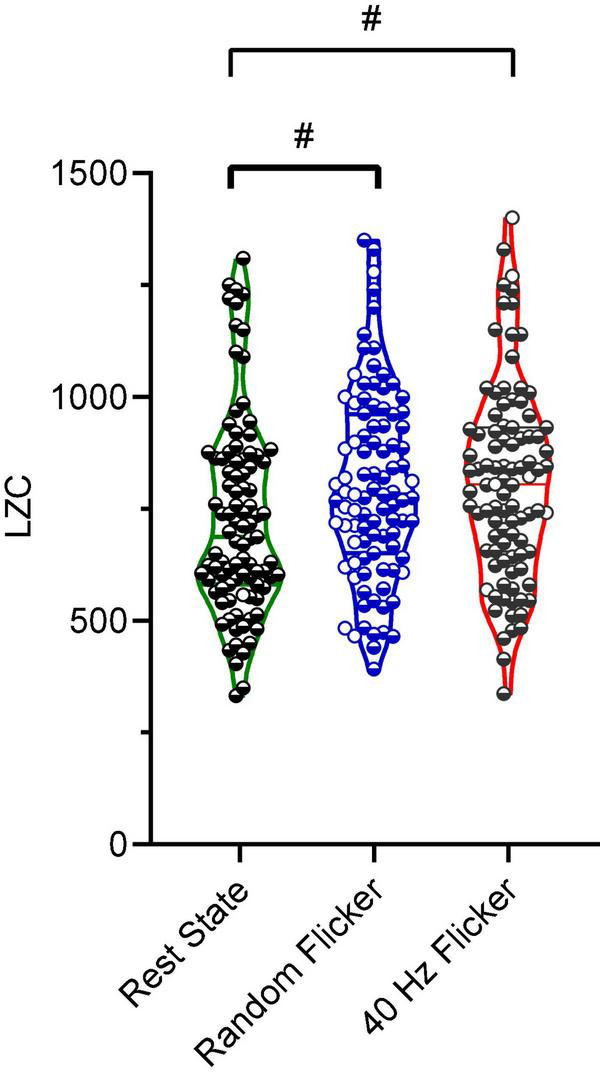
Microstate LZC. Microstate LZC under rest state, random light flicker, and 40 Hz light flicker exposure. LZC of microstate transitioning was computed for epochs with identical lengths under different conditions. Each dot referred to a single epoch during the experiment. # indicated P < 0.05 using one-way ANOVA with FDR post hoc analysis.