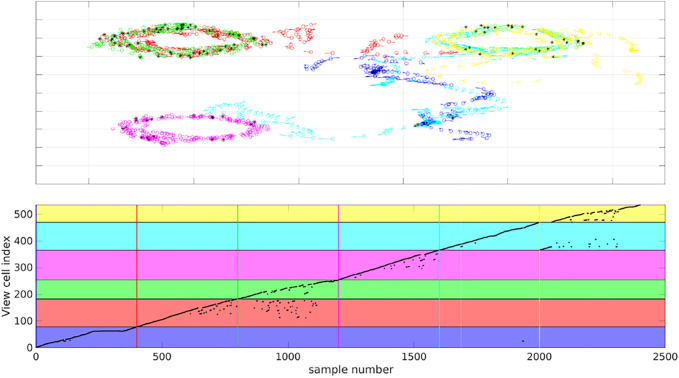
FIGURE 10.
View-cell memory sequentially presented with representations generated from all 6 simulated test sets to associate poses with proximal representations. Top panel) Colour coded quiver plots of ground truth poses of the simulated WhiskEye head during each of the 6 test sets (1 = blue, 2 = red, 3 = green, 4 = magenta, 5 = cyan and 6 = yellow). The black asterisks indicate samples which triggered a re-localisation event in the view-cell memory, i.e., the representation of that sample was close to a previous representation stored in the view-cell memory. Lower panel) Graph of view-cell index against sample number from the concatenated 6 test sets (n = 2,400). The coloured horizontal bars highlight the region within the view-cell memory that store representations encountered during a particular test set (colour matched to test sets). The vertical coloured lines set the start of each new region in the view-cell memory. Re-localisation events are marked by a step decrease in view cell index between samples, significantly, samples from test set 3 are triggering re-localisation events that reference to view-cells created in test set 2.

