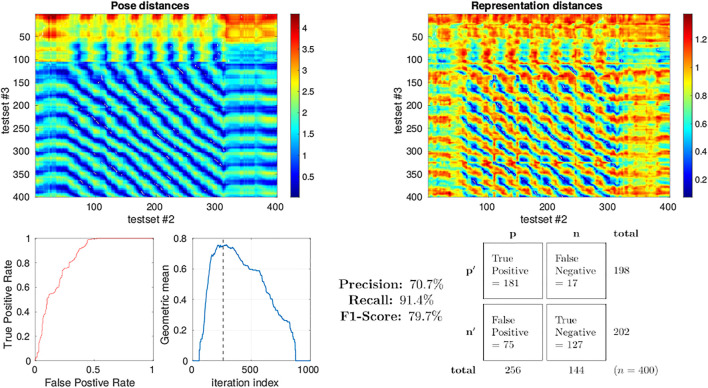
FIGURE 11.
Precision-recall curve analysis applied to simulated test sets 2 and 3 (see Figure 3) classifying for place recognition through the representation space of the trained MultiPredNet. Top left) Heatmap summarising the distance in pose space from each sample in test set 2 against each sample in test set 3. Top right) Heatmap of distances in representation space between samples in test set 2 against all samples in test set 3. White dots in the heatmap indicate classification points for each sample (n = 400) selected as the lowest distance in representation space between the 2 test sets. These points have been translated into the pose distance heatmap to determine a true or false classification. Lower left plot) Receiver Operating Characteristic (ROC) curve summarising impact of representation threshold for determining positive versus negative classifications. Lower right plot) Geometric mean of the ROC curve at each threshold iteration with the peak highlighted by the vertical dashed line. The confusion matrix contains the summed classification classes when using the optimal representation threshold determined from ROC curve with the Precision, Recall and F1-Score for the classifier calculated from them.

