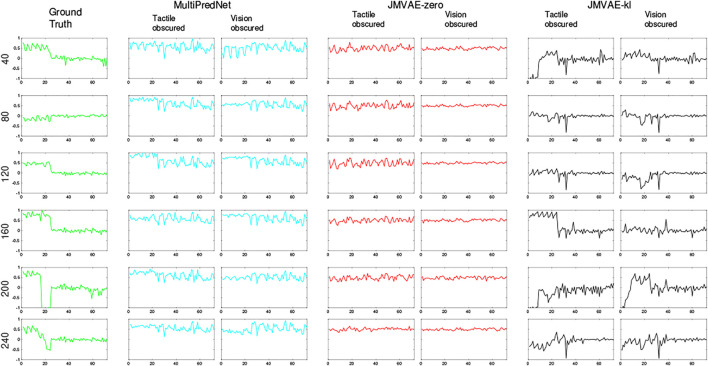
FIGURE 13.
Example tactile information captured from the whisker array at point of peak protraction at the sample points in the test set as indicated by the number on the left of each row. The first 24 values in each sample is the protraction angle of each whisker (θ whisk ) in the array with the remaining 48 values indicating the magnitude of deflection experienced by each whisker in the x and y dimensions (refer to Figure 1 for description). As in Figure 12, the plots in each row to the right of the ground truth were reconstructed by the different trained models under test during the 2 drop-out conditions. The JMVAE-kl model performed best at tactile reconstruction in all conditions (see Figure 8) as is clear from these indicative examples. Both MultiPredNet and JMVAE-zero failed to accommodate the systematic off-set in deflection angle which JMVAE-kl has, i.e., nominally zero in the last 48 values of reconstructed vector.

