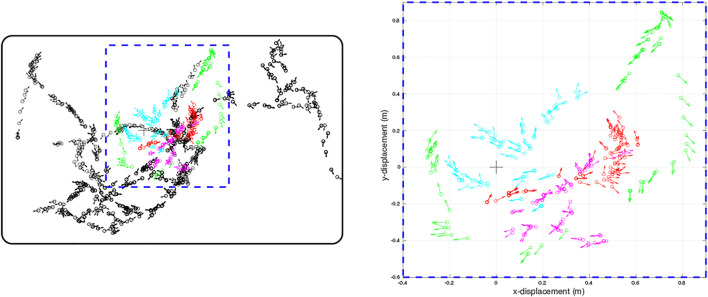
FIGURE 2.
Quiver plots of the poses of WhiskEye’s head (defined as x,y position and head direction) at each sample point taken for the training set (black) and for each of the test sets (red, cyan, magenta, green) used to evaluate the models. Each test set was recorded from a different initial pose of WhiskEye and in the arena populated with different object configurations to test for generalisation. The right panel is a scaled view of the region indicated by the blue dashed rectangle in the left panel. The bold black rectangle enclosing the sample points in the left panel indicates the boundary walls of the arena. The arena measured 3.5 m by 2.25 m

