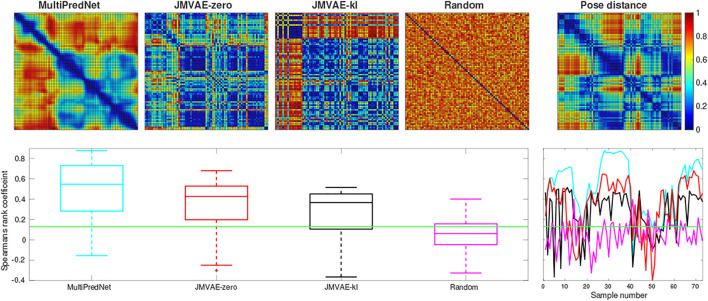
FIGURE 5.
Representational Similarity Analysis of three trained network models to measure performance at place recognition across a small example test set. The top row presents the Representational Dissimilarity Matrix (RDM) generated from (left to right) MultiPredNet, JMVAE-zero, JMVAE-kl and random representations in response to visual and tactile samples taken from physical test set 1 (73 samples). The RDM on the far right was generated from the associated ground truth 3D poses of WhiskEye’s head (x, y, θ head ) for each sample in the test set. The boxplots in the lower panel summarise statistics of the Spearman’s rank correlation coefficient (ρ) calculated between the pose and representation distances across the test set for each model as shown in the coloured line plots in the panel to the right (cyan: MultiPredNet, red: JMVAE-zero, black: JMAVE-kl, and magenta: Random). The Green horizontal line indicating 99% significance above chance (p < 0.001, N = 73).

