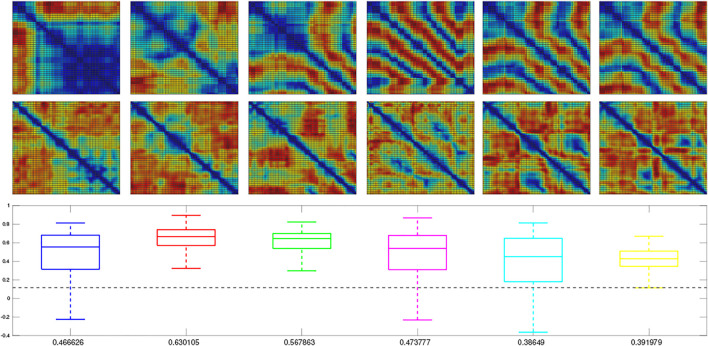
FIGURE 6.
Representation Similarity Analysis applied to each of the 6 test sets sampled from the simulator and inferred by a trained MultiPredNet Model using same network topology as for physical data sets. Top row) Representation Dissimilarity Matrices (RDMs) for the first 100 samples of pose from each set (1–6 left to right). Middle row) RDMs for the first 100 inferred joint latent representations from each set. Lower panel) Box plots summarising the Spearman’s Rank coefficient (ρ) calculated for the full 400 samples of each test set. The colour of each box plot is the same colour as quiver plots for each test set shown in Figure 3, with the black dashed line indicating significance (p < 0.001, n = 400). The mean value of ρ for each set is printed beneath each box plot for clarity.

