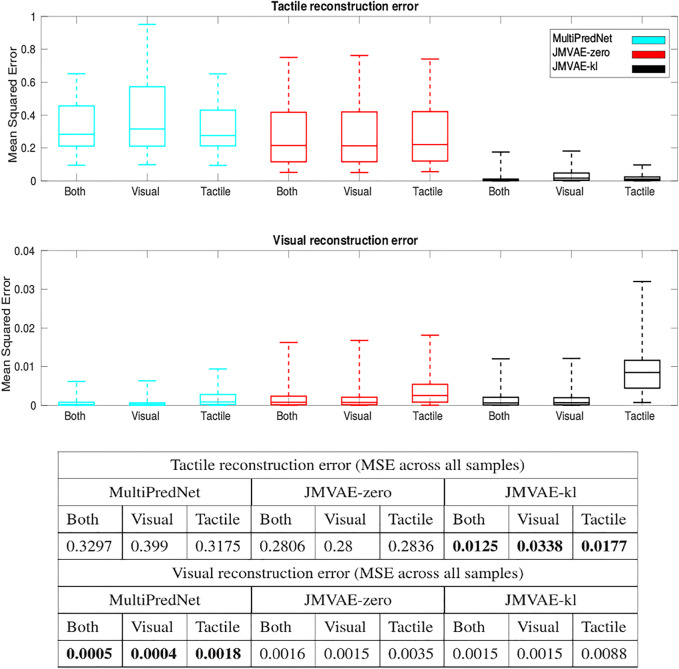
FIGURE 8.
Sensory reconstruction errors from the 3 trained model networks in response to all four concatenated test sets under 3 test conditions; Both visual and tactile sensory data available; Visual data available and tactile masked; and Tactile data available with visual data masked. The top panel box plots summarise statistics of the mean squared error between actual tactile sensory data and the reconstructed tactile impressions generated by each of the networks. The middle panel applied the same analysis to the visual reconstructions with the average MSE for each model in each of the conditions summarised in the table beneath (bold highlighting lowest error condition).

