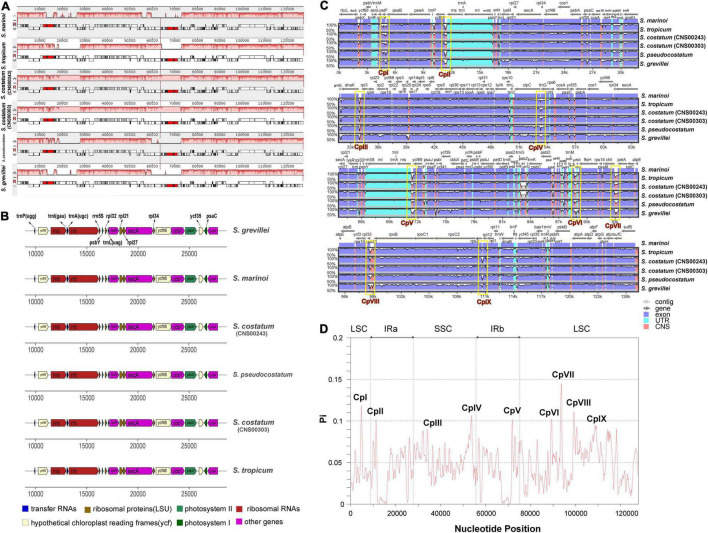
FIGURE 3.
Gene order comparison and the sequence divergence analysis of six Skeletonema chloroplast genomes. (A) Synteny comparison of the six Skeletonema cpDNAs using Mauve analysis. Rectangular blocks of the same color indicate collinear regions. (B) Gene arrangements in the inverted repeats (IR) regions of Skeletonema cpDNAs. The colors of genes are same with that in the Figure 1, indicating the different functional groups. (C) Identity plot comparing the cpDNA of six Skeletonma strains using mVISTA. The S. marinoi cpDNA (MW679506) is selected as the reference sequence. The vertical scale on the left indicated the identity percentages (range shown: 50–100%). The arrow with light gray named contig on the horizontal axis indicate the cpDNAs of Skeletonema. The dark gray arrows above the alignments indicate gene orientation. Genome regions are colored as exon, untranslated region (UTR) and conserved non-coding sequences (CNS). (D) Nucleotide diversity (Pi) of the Skeletonema cpDNA sequences based on sliding window analysis. The window length is 600 bp and the step size is 200 bp. The horizontal axis indicate the position of the midpoint of a window. The vertical axis indicate the nucleotide diversity of each window. The nine regions with great sequence divergence are also shown in the (C,D), named CpI, CpII, to CpIX.

