FIGURE 2.
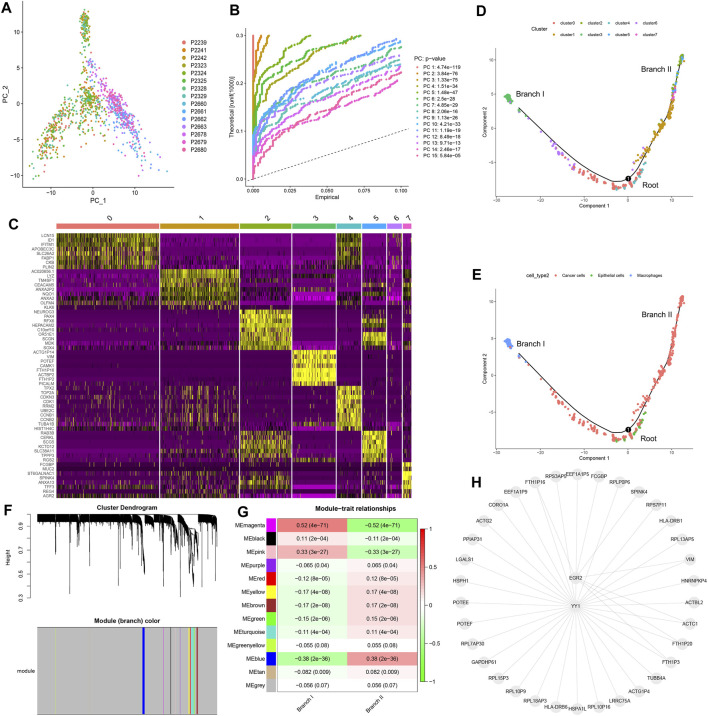
Cell trajectory analysis and WGCNA. (A) PCA based on scRNA-seq data. (B) The top 15 PCs. (C) Eight clusters were identified by tSNE algorithm, and a heat map was plotted to represent marker genes (top 10%) in each cluster. (D) Two subsets (namely, branch I and branch II) with distinct differentiation states were identified by cell trajectory analysis. (E) Cell types of subset I (branch I), subset II (branch II), and root. (F) Thirteen modules were identified using WGCNA. (G) Correlation analysis between modules and subsets. (H) Transcription factor enrichment analysis of key CDRGs. PCA, principal component analysis; PCs, principal components; tSNE, t-distributed stochastic neighbor embedding; CC, colon cancer; CDRG, CC differentiation-related gene. WGCNA, weighted correlation network analysis.

