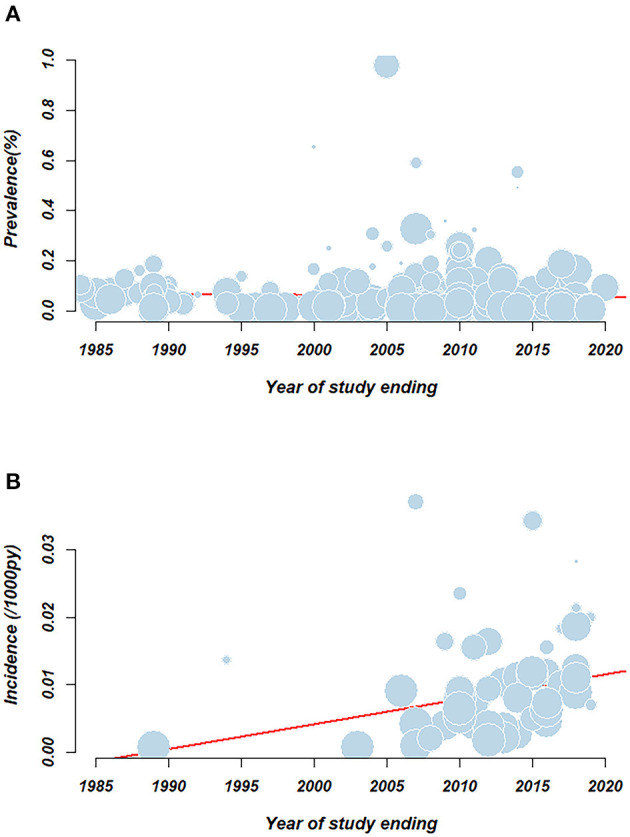
Figure 3.

Meta-regression examining the association between pooled rate and study year. (A) HCV prevalence; (B) HCV incidence. Circles represent individual record. Size of the circle represents the relative weighing of each record. Red line represents the linear regression equation.
