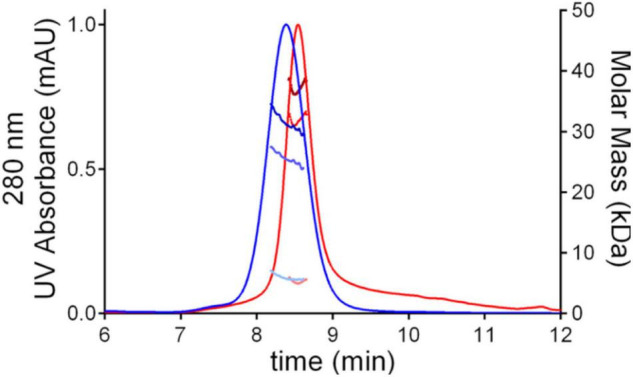
FIGURE 2.

SEC-MALS chromatograms of SARS-CoV-2 RBD produced in HEK293F cells, hu-RBD (blue), and in L. tarentolae, Lt-RBD (red). For each sample, the molar mass values associated with the glycosylated RBD molecules, the protein-only fraction, and the glycan fraction of each peak are shown using dark, intermediate, and light dots, respectively.
