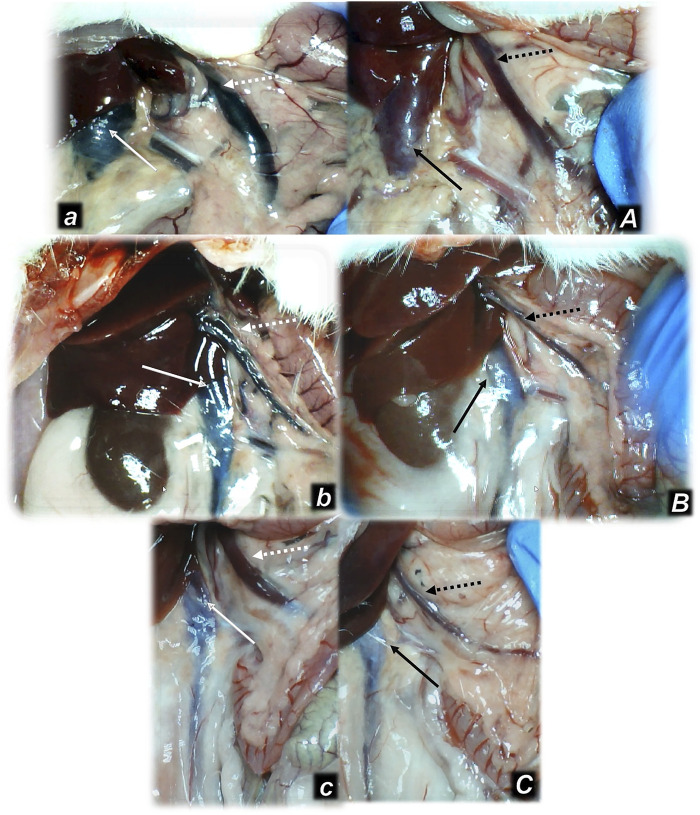
FIGURE 3.
Illustrative presentation of the inferior caval vein (full arrows) and superior mesenteric vein (dashed arrows) after the increased intraabdominal pressure and medication (sc) (saline (5 ml/kg) (white arrows, small letters, congested veins a, b, c) or BPC 157 (10 ng/kg) (black arrows, capitals, non-congested veins A, B, C): 25 mmHg (60 min) (a, A), 40 mmHg (30 min) (b, B), and 50 mmHg (30 min) (c, C). A camera attached to a VMS-004 Discovery Deluxe USB microscope (Veho, United States).

