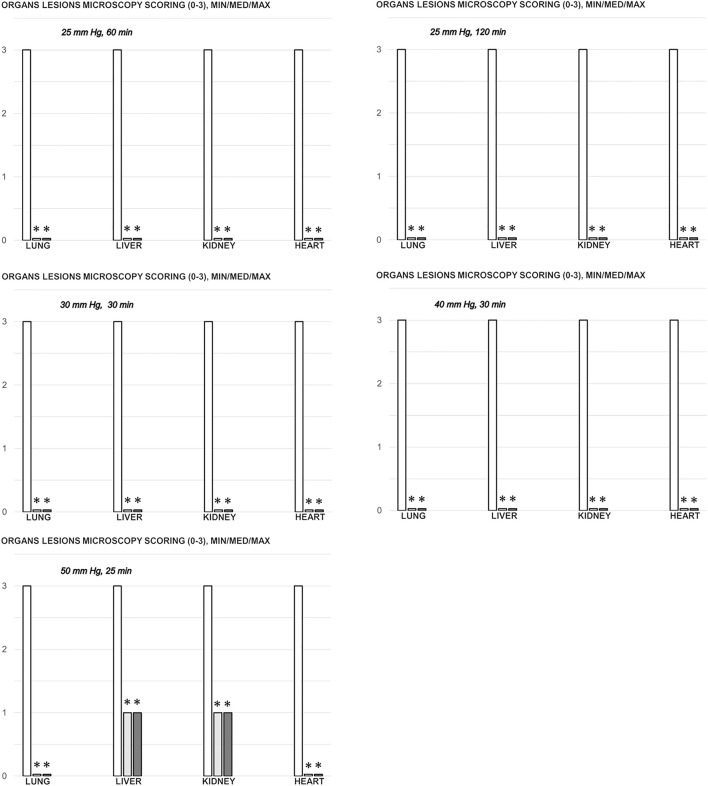
FIGURE 8.
Organs (lung, liver, kidney, heart) microscopy scoring (0–3), in the thiopental-anesthetized rats with the increased intra-abdominal pressures at 50 mmHg for 25 min, at 30 mmHg or 40 mmHg for 30 min, at 25 mmHg for 60 min increased intra-abdominal pressures-time, and in the esketamine-anesthetized rats with the increased intra-abdominal pressures at 25 mmHg for 120 min increased intra-abdominal pressures-time, following medication (BPC 157 10 μg/kg (light gray bars), 10 ng/kg (dark gray bars); saline 5 ml/kg (white bars)) given subcutaneously at 10 min increased intra-abdominal pressures-time. Minimum (min), maximum (max), median (med), *P˂0.05, vs. control. Figure 9. Illustrative presentation of gross and microscopic presentation. Gross presentation. Stomach (a, A) and liver (b,B) (white letters) after the increased intraabdominal pressure and medication (sc) (saline (5 ml/kg, left, stomach and duodenum with multiple small hemorrhagic lesions (a), and congested liver (b) presentation) or BPC 157 (10 ng/kg, right, stomach and duodenum, and liver A, B): 25 mmHg (30 min) (a, A) and 40 mmHg (30 min) (b, B). A camera attached to a VMS-004 Discovery Deluxe USB microscope (Veho, United States). Microscopy presentation. Stomach (a, A) and colon (b, B) (black letters) presentation in rats with the increased intra-abdominal pressure at 50 mmHg for 25 min treated at 10 min increased intra-abdominal pressure time with saline (control, a, b) or BPC 157 (A, B). The control group showed marked hyperemia and congestion of the stomach wall (a) and a reduction of the colonic crypts with focal denudation of the superficial epithelia (b). BPC 157-treated rats exhibit presentation close to normal gastrointestinal tract presentation (A, B). (HE; a, A, magnification ×100, scale bar 200 μm; b, B, magnification ×200, scale bar 100 μm).

