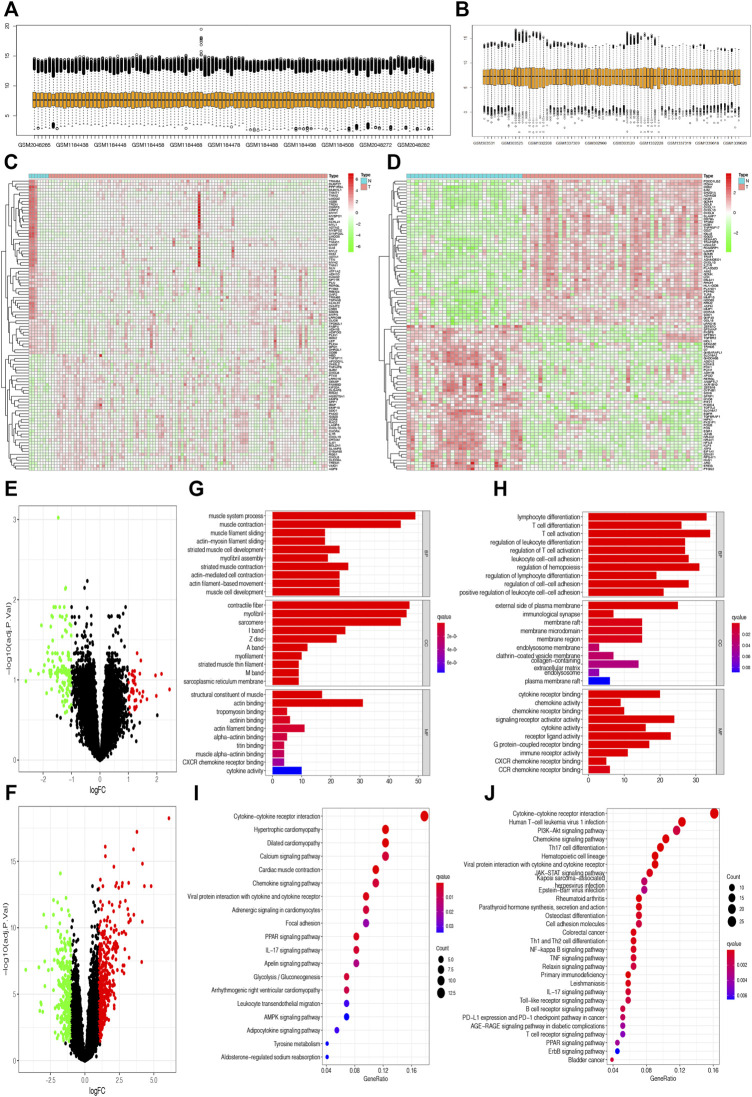
FIGURE 2.
Selection of differentially expressed genes and enrichment of related pathways. (A and B) Gene expression in different samples was normalized in the GPL570 and GPL96 databases. (C and D) The heatmaps show the top 50 differentially expressed genes between synovial tissues and rheumatoid arthritis (RA) tissues in the GPL570 and GPL96 databases. (E and F) The volcano plots show the differentially expressed genes with false discovery rate (FDR) <0.05 and |log Fold-Change| ≥ 1 in the GPL570 and GPL96 databases. (G and H) The Gene Ontology (GO) enrichment analysis based on differentially expressed genes was performed in the GPL570 and GPL96 databases. (I and J) The Kyoto Encyclopedia of Genes and Genomes (KEGG) enrichment analysis was performed to explore the associated pathways in the GPL570 and GPL96 databases.

