FIGURE 4.
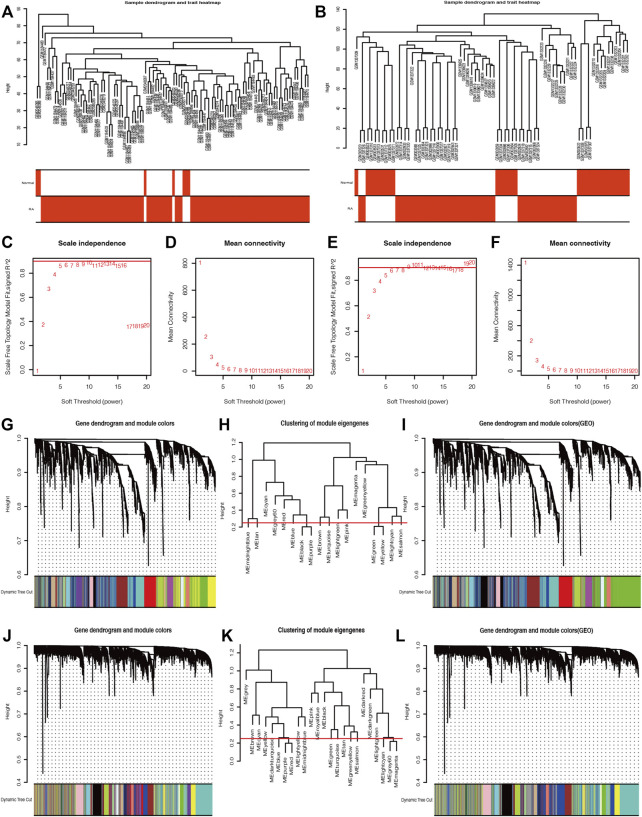
The weighted gene co-expression network analysis (WGCNA) algorithm was applied to explore the most correlated gene modules. The sample dendrogram and trait heatmaps of the GPL96 database (A) and GPL570 database (B). The optimum soft threshold power was determined based on the scale independence plot and mean connectivity plot in the GPL570 (C and D) and GPL96 databases (E and F). The gene clustering dendrogram was constructed based on dissimilarity, and the related gene modules were merged with the dynamic tree cut method by hierarchical clustering in the GPL570 (G–I) and GPL96 databases (J–L).

