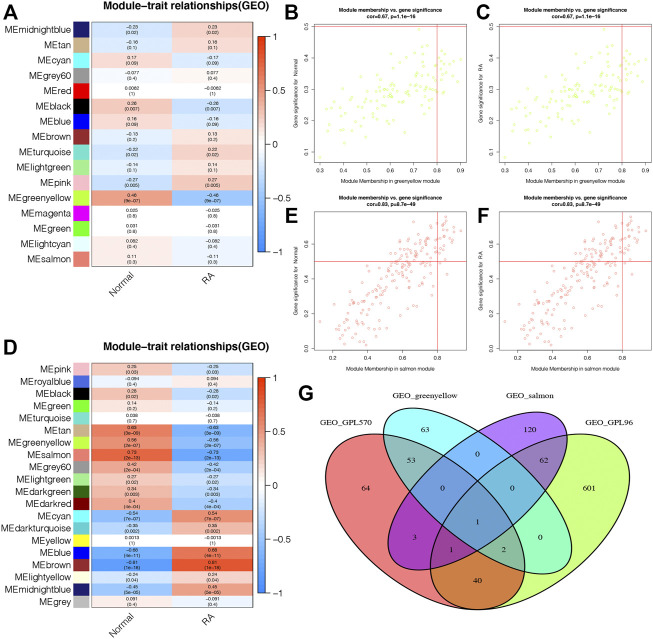
FIGURE 5.
The selection of potential biomarkers based on the most correlated gene modules and differentially expressed genes. (A and B) The module–trait relationship plots shows that ME-greenyellow module and ME-salmon module were the most correlated gene modules in the GPL570 and GPL96 databases, respectively. The genes in the ME-greenyellow module and ME-salmon module had a significant correlation with normal and rheumatoid arthritis (RA) samples in the GPL570 (C and D) and GPL96 databases (E and F). (G) The ME-greenyellow module genes, the ME-salmon module genes, and differentially expressed genes in the GPL570 and GPL96 databases were intersected to screen out final potential biomarkers.

