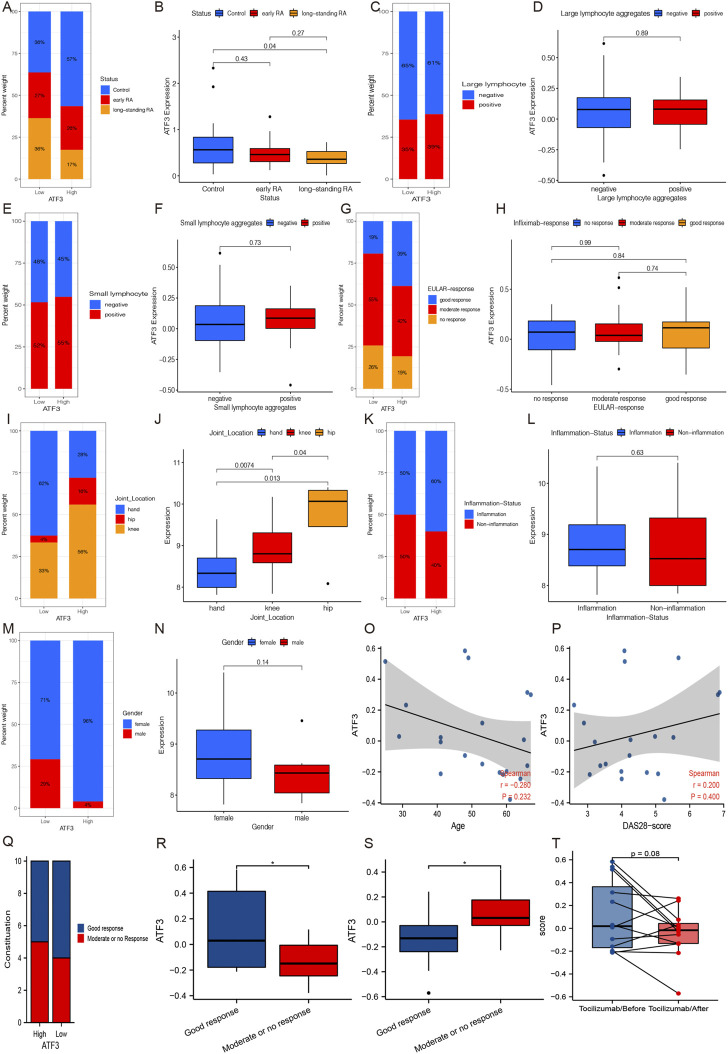
FIGURE 6.
The relationships between ATF3 and clinical parameters. (A and B) GSE13026 shows that ATF3 in long-standing rheumatoid arthritis (RA) patients is significantly lower than that in normal individuals, and its expression in long-standing RA patients seemed lower than that in early RA patients. (C and D) Large lymphocyte aggregation status in synovium seemed to have no relationships with ATF3 expression in GSE21537. (E and F) Similarly, small lymphocyte aggregation status still has no relationship with ATF3 in GSE21537. (G and H) Patients with good infliximab response accounted for a higher percentage in the high ATF3 group, but the difference of ATF3 among different infliximab-response groups was not significant. (I and J) GSE48780 indicates that ATF3 expression was significantly different among different joint synovium and its expression in hip synovium was significantly higher than that in knees and hands. (K and L) ATF3 in inflammation-infiltrated synovium was slightly higher than that in non-inflammation synovium, and patients with inflammation-infiltrated synovium accounted for a higher percentage in the high ATF3 group. (M and N) ATF3 expression seemed higher in female patients in GSE48780. ATF3 had a slight decrease along with the increment of age (O), while there was a positive correlation between ATF3 and DAS-28 score (P), an index to evaluate RA activity. (Q and R) ATF3 expression in RA patients with a good response was significantly higher than that in patients with a limited response before treatment with tocilizumab or methotrexate. (S and T) ATF3 expression in RA synovium after treatment was significantly lower in patients with good response, especially treatment with tocilizumab.

