FIGURE 3.
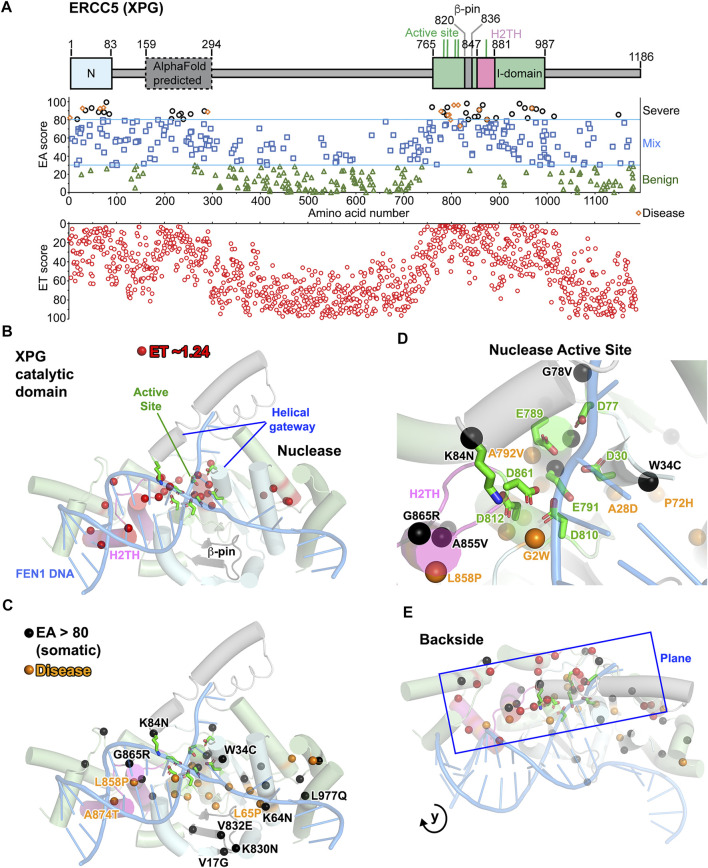
XPG: ERCC5 (XPG) ET, disease, and EA80 VUS. (A) Top, ERCC5 (XPG) domain schematic; middle, disease mutants and VUS mapped with EA scores; bottom, amino acid residue mapped with ET scores. (B) The most significant residues based on ET scoring, mapped onto a cartoon depiction of XPG catalytic domain (PDB: 6VBH) with substrate DNA model based on FEN1 overlay (PDB: 5UM9). (C) Disease and EA80 VUS, mapped onto a cartoon depiction of XPG catalytic domain, as in (B). (D) Zoom of nuclease active site, highlighting disease and EA80 mutations. Model and colors are the same as (C). (E) Different perspective of XPG catalytic domain cartoon depiction reveals how the plane formed by ET, disease, and EA80 sites extends to the backside of XPG, opposite to the dsDNA binding.

