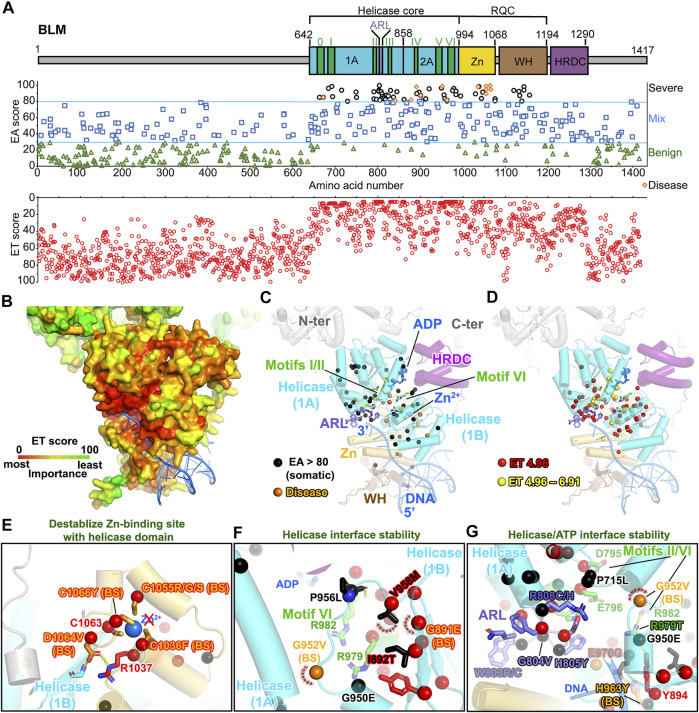
FIGURE 6.
BLM helicase domains are the main target of EA80 VUS. (A) Top, BLM domain schematic; middle, disease mutants and VUS mapped with EA scores; bottom, amino acid residue mapped with ET scores. (B) ET mapping on BLM structure (PDB: 4O3M + RoseTTAFold) in surface presentation. DNA is shown in blue ribbon. (C) Disease mutation and EA80 VUS (orange and black spheres) are mapped on BLM structure shown in cartoon depiction. Domains are colored, corresponding to (A). (D) The most significant residues (red and yellow spheres) based on ET scoring are mapped onto the BLM structure. (E–G) Close-up view of impacts of disease and EA80 VUS on helicase domain interfaces of BLM. Sphere and sticks are colored according to EA/ET on (C) and (D). Overlapping EA/ET/disease residues are shown in their corresponding colors. BS, Bloom syndrome.

