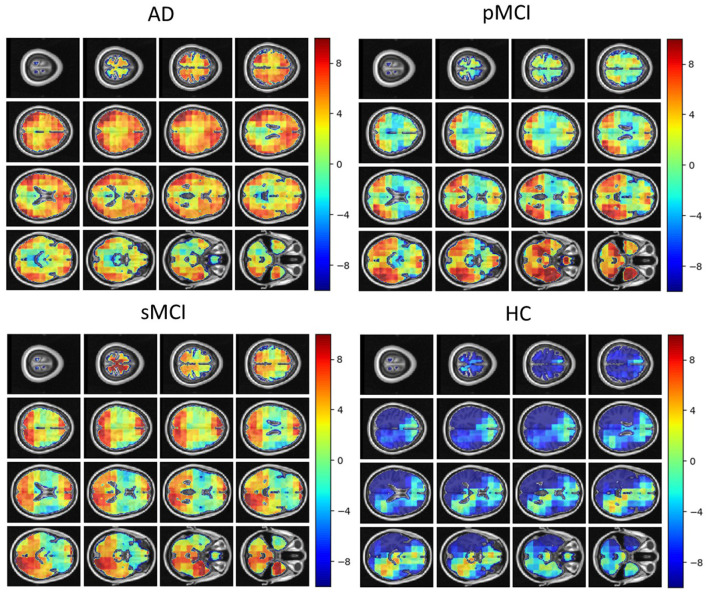
Figure 8.
Local brain-PAD maps for randomly sampled participants from clinical groups in cross-sectional OASIS3 dataset. Positive values indicate an increased pattern of local volume differences compared to healthy ageing patterns at the respective age. HC, Healthy Controls; pMCI, progressive MCI; sMCI, stable MCI; AD, Alzheimer's Disease.

