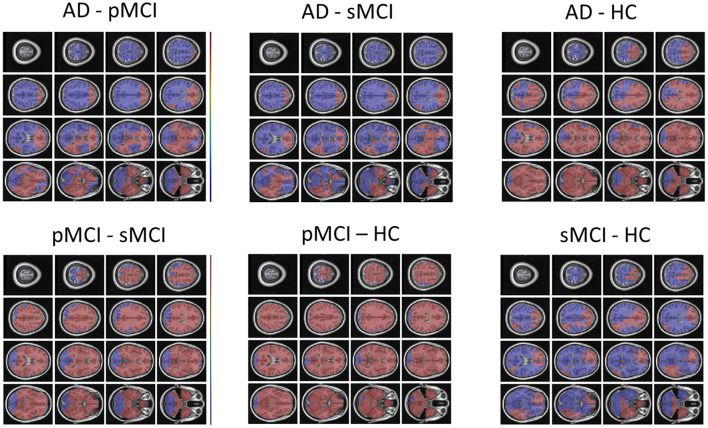
Figure 9.
FSL Randomise maps for different combinations of clinical groups in cross-sectional OASIS3 using voxel-level brain-age predictions. Red coloured voxels indicate a significant statistical t-test after correcting for multiple comparisons. Blue regions were not significant after correction. HC, Healthy Controls; pMCI, progressive MCI; sMCI, stable MCI; AD, Alzheimer's Disease.

