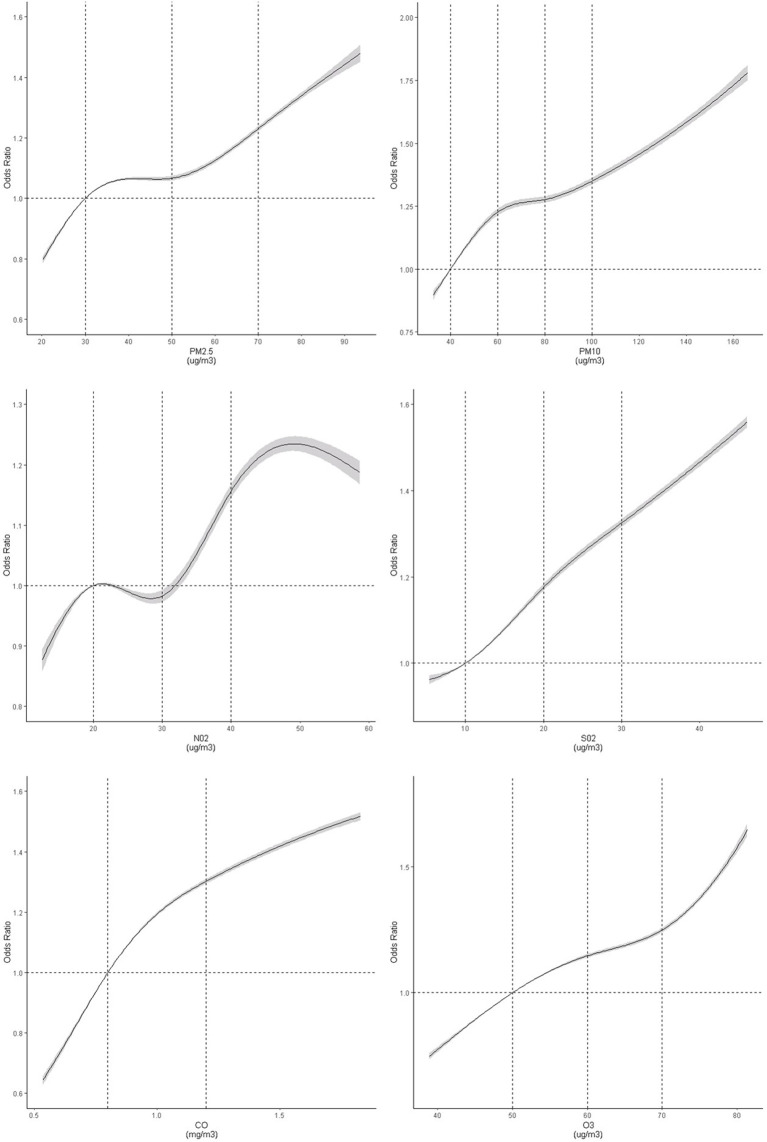
Figure 3.
Dose–response association between air pollutants and risk of thyroid nodules. Restricted cubic spline was fitted for each air pollutant concentrations and thyroid nodules, with selected knots and reference for each air pollutants (PM2.5: 30 [Ref], 50, 70 ug/m3; PM10: 40 [Ref], 60, 80, 100 ug/m3; NO2: [20], 30, 40 ug/m3; SO2: 10 [Ref], 20, 30 ug/m3; CO: 0.8[Ref], 1.2 mg/m3; O3: 40[Ref], 50, 60, 70 ug/m3). The model was adjusted for age, sex, fasting blood glucose, body mass index, triglyceride, low density lipoprotein, high density lipoprotein, urine iodine, O3, Gross Domestic Product, education index, and average smoking rate. The graph indicated a non-linear association between air pollutant concentrations and thyroid nodules (test for spline model: P <0.0001). P-values for nonlinear tests were 0.0029, <0.0001, 0.0144, 0.9585, 0.0118 and 0.21473 for six pollutants, respectively.

