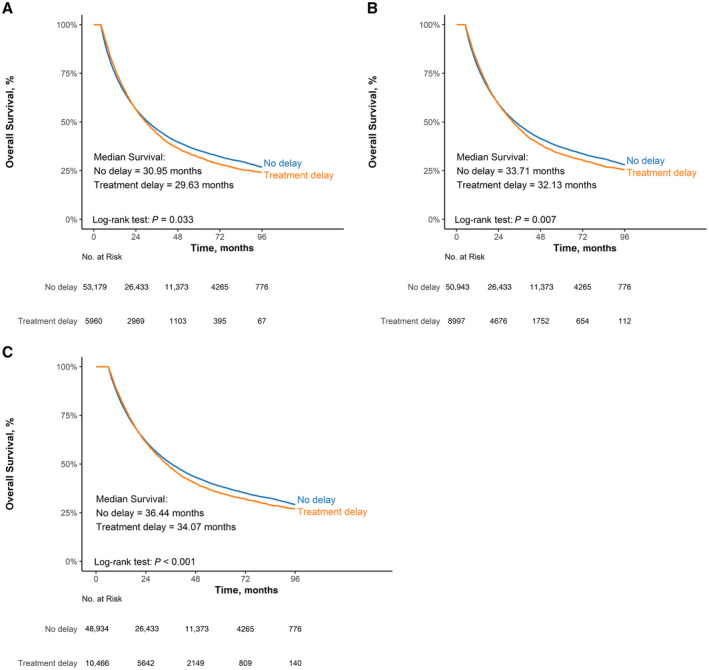
FIG. 2.

Kaplan‐Meier curve showing estimated OS in patients with no delay versus delay in treatment (landmark analysis). (A) 120 days landmark, (B) 150 days landmark, and (C) 180 days landmark. Overall median survivals are comparable between the two groups, although there is a statistically significant difference in median survival due to the large sample size.
