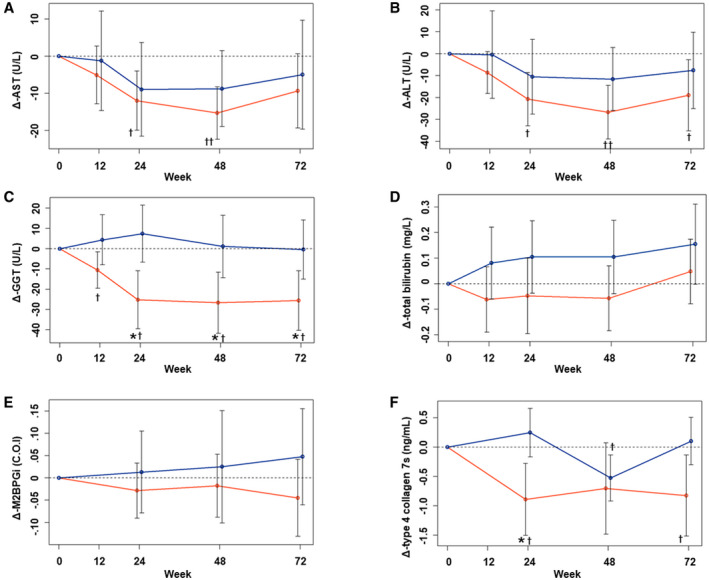
FIG. 3.

Changes in parameters from baseline for endpoint 2. Mean changes in AST (A), ALT (B), GGT (C), total bilirubin (D), M2BPGi (E), and type 4 collagen 7s (F) in the IPR (red line) and CTR (blue line) groups from baseline are shown. Data are presented as the mean and SD. *P < 0.05 and **P < 0.01 between the groups, according to Welch’s two‐sample t‐test. † P < 0.05 and †† P < 0.01 versus baseline, according to the single‐sample t‐test.
