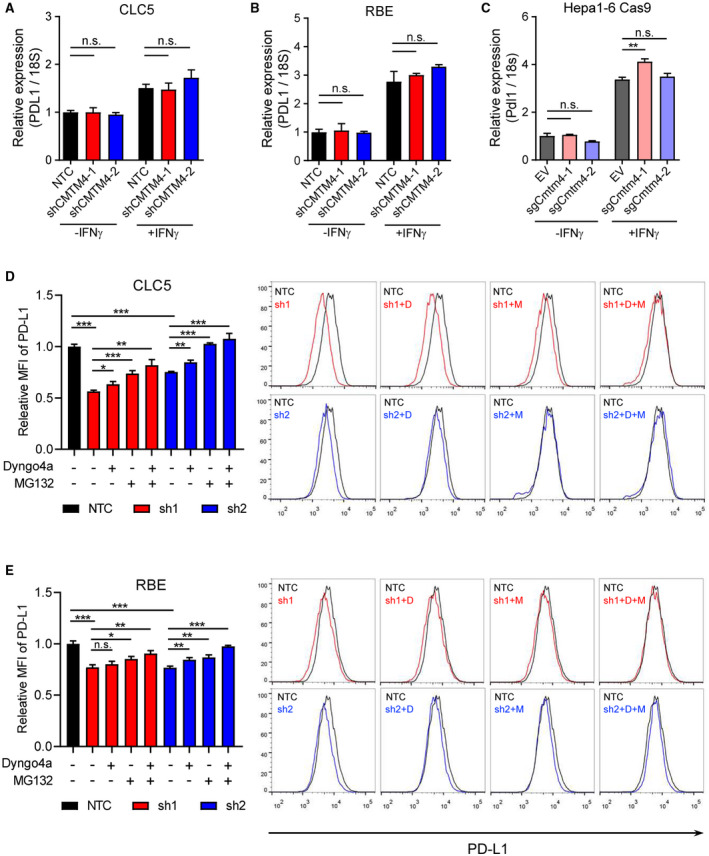
FIG. 3.

CMTM4 stabilized PD‐L1 through posttranslational mechanisms. (A‐C) PD‐L1 mRNA expressions measured by quantitative RT‐PCR in control and CMTM4‐knockdown or CMTM4‐knockout CLC5, RBE, and Hepa1‐6‐Cas9 cells with or without IFN‐γ stimulation (24 hours). CLC5 (D) and RBE (E) control and CMTM4‐knockdown cells were stimulated with IFN‐γ (24 hours). A total of 30 μM Dyngo4a (clathrin‐dependent endocytosis inhibitor) and/or 8 μM MG132 (proteasome inhibitor) were added into culture medium 24 hours and 6 hours before flow cytometry analysis, respectively. Relative MFI (left) and representative histograms (right) of surface PD‐L1 level. Error bars indicate mean ± SD. *P < 0.05, **P < 0.01, ***P < 0.001. (A‐C) Student t test. Abbreviations: D, Dyngo4a; M, MG132; n.s., not significant.
