
FIG. 6.
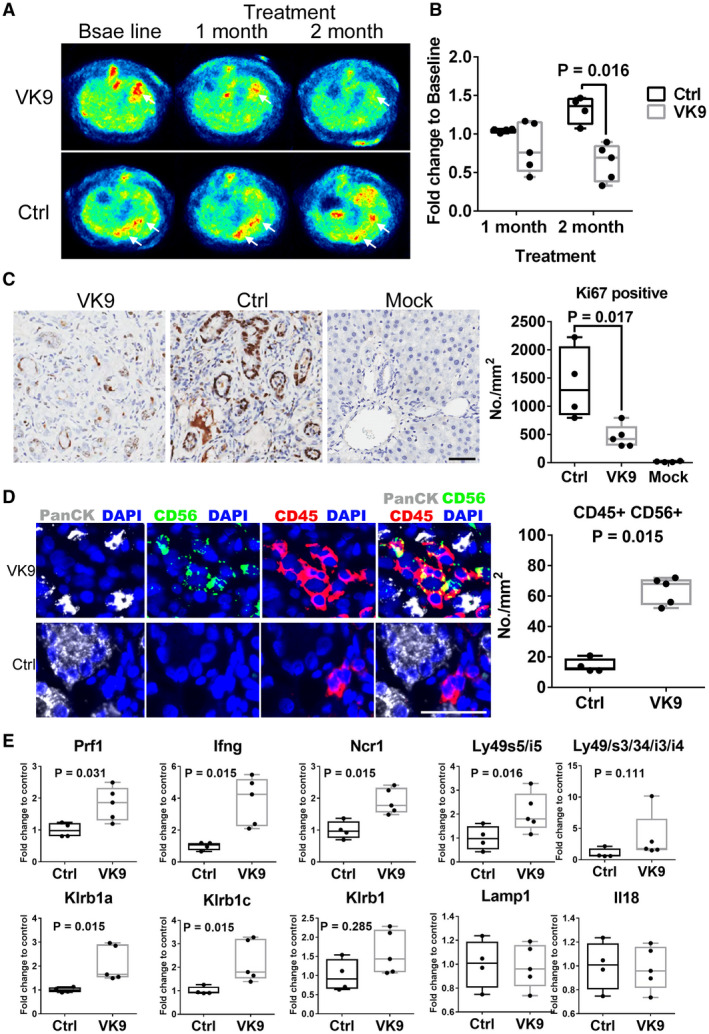
Anti‐Globo H antibody suppresses tumor growth in rat ICC model. (A) Following the administration of TAA for 24 weeks, rats exhibiting 18F‐FDG‐PET‐detectable tumors were treated intravenously with 300 µg anti‐Globo H antibody, mAbVK9 (n = 5), or PBS (n = 4) every week for 8 weeks. Arrowheads indicate tumor sites. (B) Alterations of SUV at 1 and 2 month following treatment with mAbVK9. The 18 F‐FDG uptake by tumors was quantified using SUV mean, and the fold change was calculated by normalizing 18F‐FDG uptake after treatment to baseline for each animal. (C) IHC staining for Ki67 in rat ICC tissue of the mAbVK9‐treated group, control group, and vehicle‐treated group. At the end of treatment, rats were sacrificed and liver was excised for IHC studies. Randomly selected areas from each tumor were analyzed. The number of Ki67‐positive cells per square millimeter as compared between the mAbVK9‐treated group and control group using StrataQuest. Scale bars indicate 60 μm (original magnification ×40). (D) Left panels are representative photomicrographs of multiplex panel (PanCK, white; CD56, green; CD45, red; and 4′,6‐diamidino‐2‐phenylindole) from rats treated with mAbVK9 or PBS control. Right panel shows the number of CD45‐positive and CD56‐positive cells per square millimeter in the mAbVK9‐treated group and control group using Metamorph. Scale bars indicate 60 μm (original magnification ×40; Student t test). (E) Quantitative real‐time PCR analysis of the indicated NK cell markers in the mAbVk9‐treated group and control group. Lysosomal‐associated membrane protein 1 (Lamp1) and IL‐18 represented non‐NK cell markers. Graphs represent means ± SEM. Abbreviations: Ctrl, control; DAPI, 4′,6‐diamidino‐2‐phenylindole; Ifng, interferon‐gamma; Klr, killer cell lectin‐like receptor; Ncr1, natural cytotoxicity triggering receptor; Prf1, perforin.