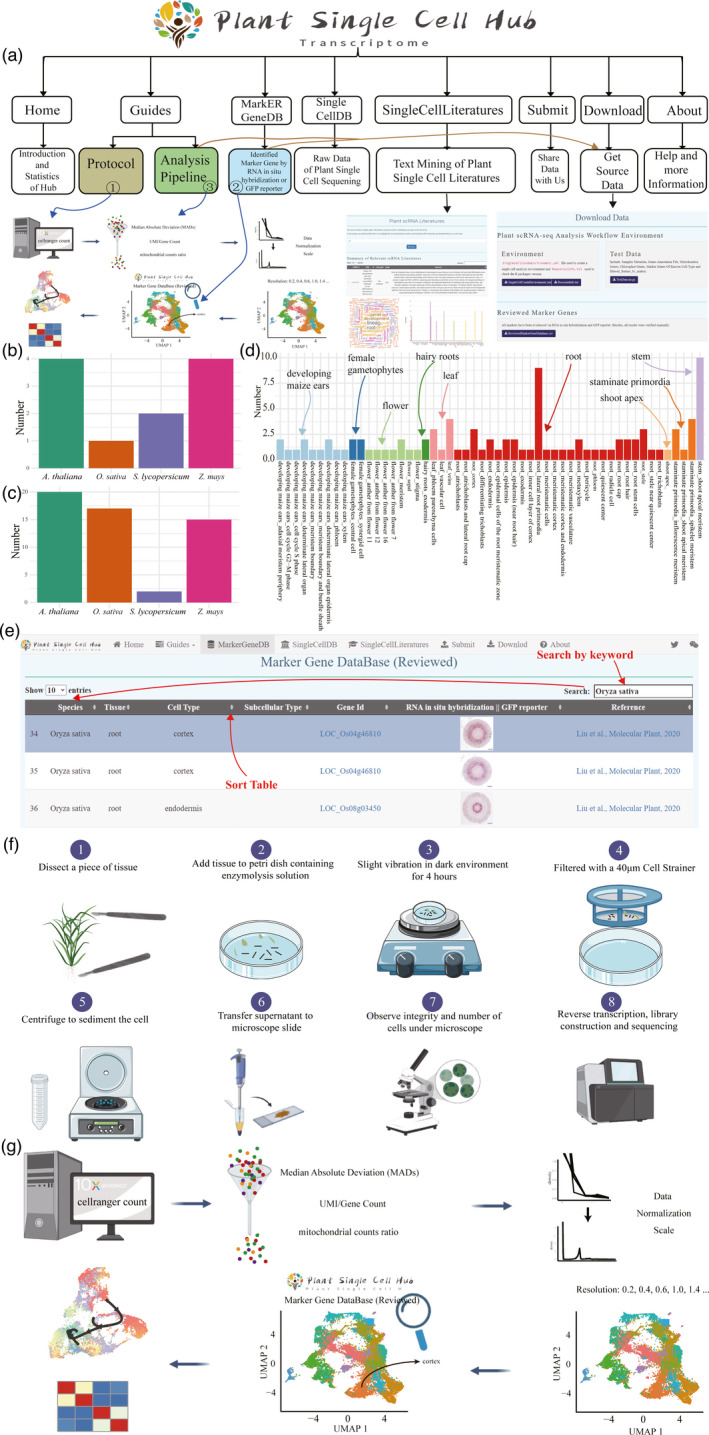
Figure 1.

Statistics of cell markers and function interface in PsctH. (a) Overview of PsctH sitemap, which provided the information and relationship about the pages. Distribution of tissues (b) and cell types (c) for different species in PsctH. (d) Distribution of cell markers for different tissue types in PsctH. (e) The web images in the ‘MarkerGeneDB’ page and schematic diagram illustrate the process of browsing and keyword searching (such as gene id, species, tissue, and cell type) the database, which allows to quickly search for marker genes of cells in different tissues. (f) Schematic diagram highlighting the experimental setup for prepare protoplasts used for single‐cell RNA sequencing, which includes enzymatic hydrolysis of tissue samples and single‐cell quality detection under the microscope. (g) Illustration of the workflow used for performing plant single‐cell RNA data analysis, which includes filter out poor‐quality cells, and normalize and identify variable genes, cluster, and annotation cell type.
