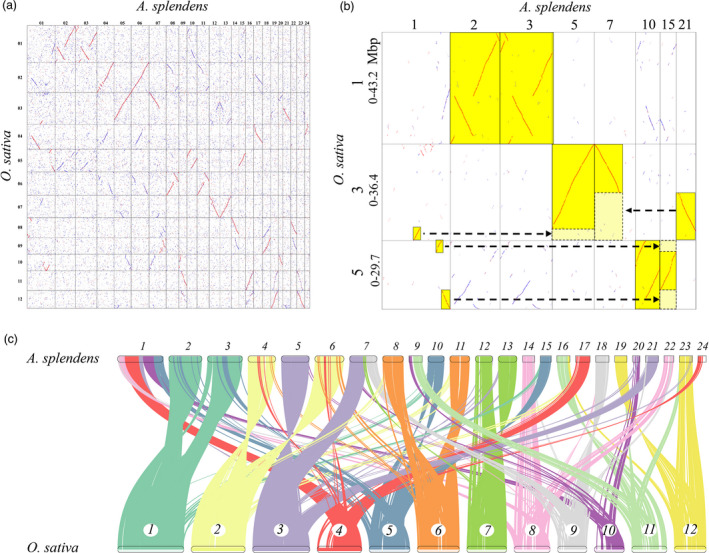
Figure 3.

(a) Dotplots showing genes homologous between the A. splendens and O. sativa genomes. (b) Example of homologous gene dotplots for A. splendens and O. sativa. Chromosome numbers and regions (in Mbp) are shown. Best hit (orthologous) genes are red dots, secondary hits (outparalogous) are blue dots and the others are shown in grey. Highlights show the best matched chromosomal regions. Arrows show correspondence produced by chromosome breakages during evolution. (c) Gene synteny between the A. splendens and O. sativa genomes.
