Figure 6.

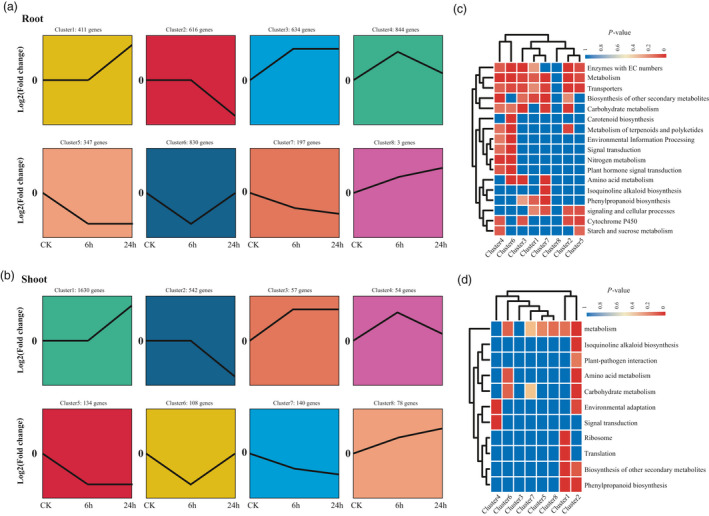
Expression patterns and enrichment analysis of DEGs under salt stress. (a–b) Cluster analysis of DEGs displaying a log2 fold change (with absolute value >2) of transcripts during salt stress at 6 and 24 h in root and shoot respectively. The comparisons include control versus control (CK), 6 h versus control (6 h) and 24 h versus control (24 h). (c–d) Heat maps of significantly enriched pathways during salt stress. The blue and red colours indicate the P‐values for significantly enriched pathways for each cluster.
