Figure 3.

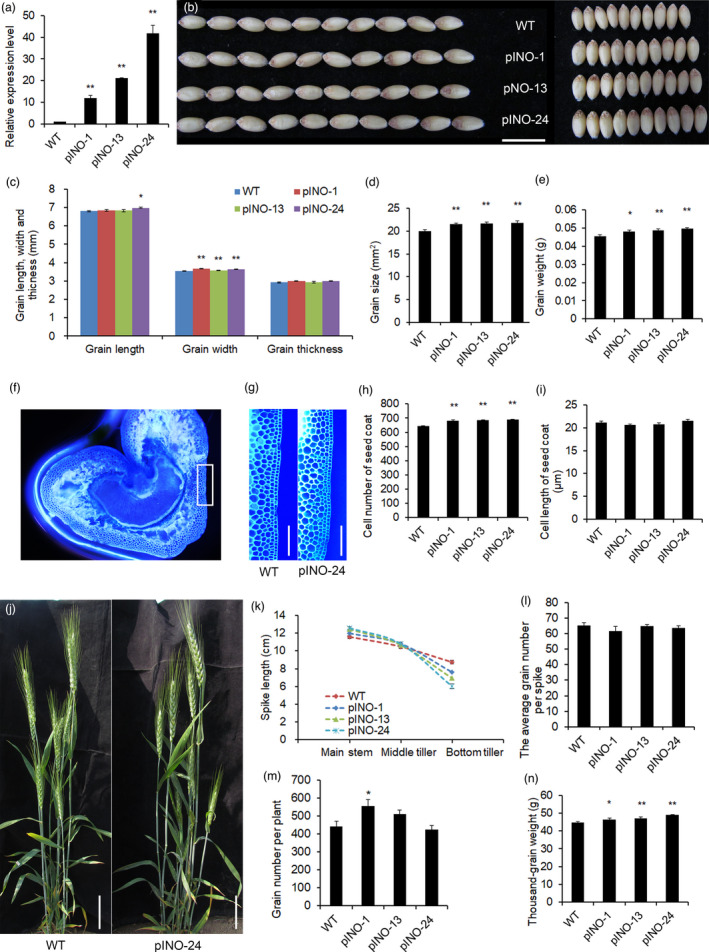
The phenotypes of pINO::TaCYP78A5‐transgenic wheat lines (pINO lines) and wild‐type plant (WT). (a) Relative expression of TaCYP78A5 in pINO lines and WT (n = 3). (b) Grain phenotypes of pINO lines and WT. Bar = 1 cm. (c) Grain length, width and thickness of pINO lines and WT (n ≥ 10). (d, e) Grain size (d) and grain weight (e) of pINO lines and WT (n ≥ 10). (f) A representative cross section of the grain 15 days after fertilization (DAF) stained with Fluorescent Brightener. (g) Enlarged view of the seed coat cells of pINO lines and WT. Bar = 200 µm. (h, i) Cell number (h) and cell length (i) of the outer seed coat of grain 15 DAF (n ≥ 20). (j) The plant architecture of pINO‐24 and WT. (k) The spike length of the main stem and the tillers of pINO line and WT (n > 10). (l, m) The average grain number per spike (l) and grain number per plant (m) of pINO lines and WT (n = 20). (n) Thousand‐grain weight of pINO lines and WT (n > 10). Data are shown as the mean ± SE, *P < 0.05, **P < 0.01 by Student’s t‐test.
