
Figure 2.
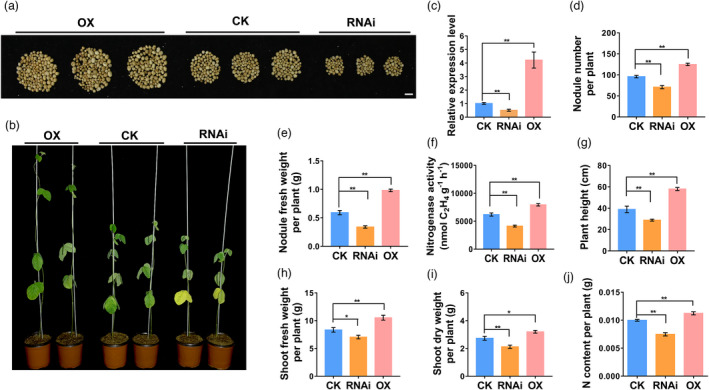
Phenotypic analysis of nodulation of transgenic composite soybean plants overexpressing (OX) or suppressing (RNAi) GmHSP17.9. (a, b) Growth performance of nodules (a) and composite transgenic soybean plants (b) at 28 dpi. Scale bar in (a) =1 cm. (c) Relative expression level of GmHSP17.9 in nodules at 28 dpi. Relative expression level was calculated as the fold change of the expression value of GmHSP17.9 in transgenic nodules to that of in wild type and was normalized based on the expression of GmActin11 used as reference gene. (d) Nodule number. (e) Nodule fresh weight. (f) Nitrogenase activity measured by the acetylene reduction assay. (g) Plant height. (h) Shoot fresh weight. (i) Shoot dry weight. (j) N content. CK refers to transgenic plants carrying empty vector. These experiments were repeated at least three times and similar results were obtained. Data are means with SE from three independent replicates (n = 10).