
Figure 3.
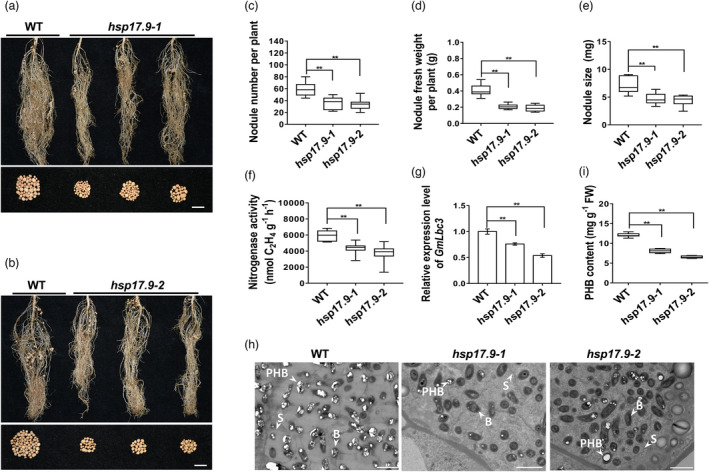
Effect of altered expression of GmHSP17.9 on nodulation of hsp17.9 plants at 28 dpi. (a, b) Nodule growth performance of hsp17.9‐1 (a) and hsp17.9‐2 (b) at 28 dpi. (c) Nodule number per plant. (d) Nodule fresh weight per plant. (e) Nodule size (single nodule weight). (f) Nitrogenase activity of nodules measured by the acetylene reduction assay. Wild‐type (WT) Williams 82 and hsp17.9 plants were grown in the vermiculite with rhizobia inoculation. (g) Quantitative real‐time RT‐PCR analysis of GmLbc3 expression in nodules. (h) Ultrastructure of nodules of hsp17.9 plants. The ultrastructure was observed by transmission electron microscopy (TEM) (n = 5). PHB: poly‐β‐hydroxybutyrate bodies; S: symbiosome; B: bacteroids. (i) Content of PHB in nodules. PHB was extracted by sodium hypochlorite in chloroform, and the turbidity was monitored at 530 nm using a fluorescence spectrophotometer. FW: fresh weight. Data presented are averaged from three independent experiments (n = 10) and similar data were obtained. For each box plot, the centre black line represents the median; the box limits are the upper and lower quartiles; the whiskers represent the lowest or highest data point within the 1.5 interquartile range of the lower or upper quartile; and the dot outliers are the data points outside the 1.5 interquartile range of the lower or upper quartile. (a,b) Scale bar = 1 cm.