Figure 6.

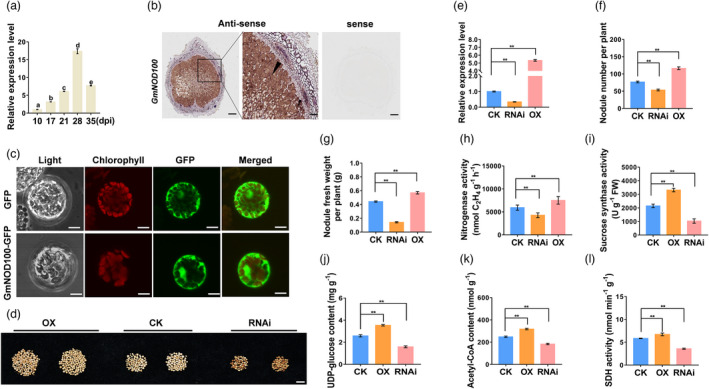
Phenotypic analysis of nodulation of transgenic composite soybean plants overexpressing (OX) or suppressing (RNAi) GmNOD100. (a) Expression patterns of GmNOD100 in nodules at 10, 17, 28 and 35 dpi. The different letters indicate significant differences, P < 0.05. (b) RNA in situ hybridization analysis of expression of GmNOD100 in nodules. Black arrow head indicated the infected cells of nodules. Scale bar = 200 μm (left panel of antisense and sense) and 100 μm (right panel of antisense). (c) Subcellular localization of GmNOD100‐GFP in Arabidopsis protoplasts. GmNOD100‐GFP signal was distributed in the cytoplasm. GmNOD100‐GFP: GmNOD100 and GFP fusion protein. Scale bars = 10 μm. (d) Phenotype of nodules at 28 dpi. Scale bar = 1 cm. (e) Relative expression level of GmNOD100 in nodules at 28 dpi. Relative expression level was calculated as the fold change of the expression value of GmNOD100 in transgenic nodules to that of in wild type and was normalized based on the expression of GmActin11. (f) Nodule number. (g) Nodule fresh weight. (h) Nitrogenase activity. (i) Sucrose synthase activity. (j) Content of UDP‐glucose. (k) Content of acetyl‐CoA. (l) Succinate dehydrogenase (SDH) activity. CK refers to transgenic nodules carrying empty vector. These experiments were repeated at least three times and similar results were obtained. Data are means with SE from three independent replicates (n = 10).
