Figure 1.

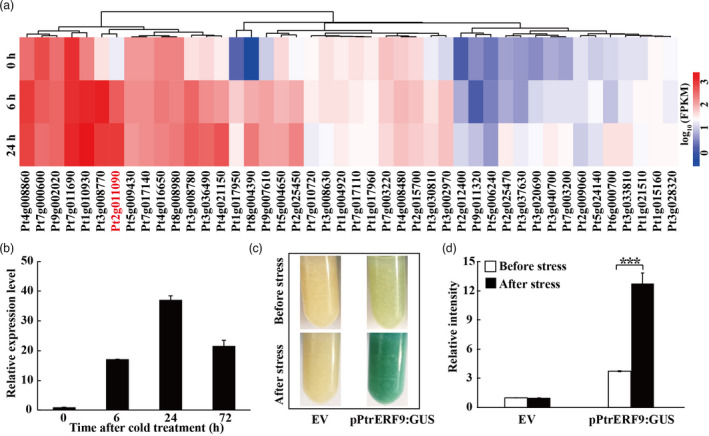
The expression of ERF genes analysis under cold treatment in Poncirus trifoliata. (a) Expression profiles of 44 ERF genes in trifoliate orange under cold stress. (b) Relative expression of PtrERF9 was quantitated by qPCR in response to low temperature. Error bars represent ± SE (n = 3). (c, d) GUS staining (c) and relative GUS intensity (d) analysis in sweet orange callus transformation with empty vector (EV) and pPtrERF9: GUS in response to cold treatment. Error bars represent ± SE (n = 3). Asterisks indicate significant difference between the vectors under before and after the cold treatment (***P < 0.001).
