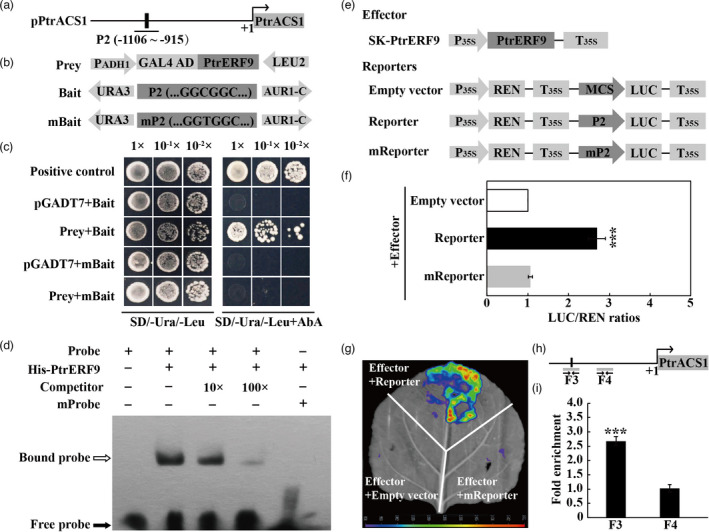
Figure 9.

PtrERF9 binds to PtrACS1 promoter and positively regulates its expression. (a) Schematic diagram of PtrACS1 promoter, black rectangle indicates the GCC‐box element in the partial promoter fragment (P2). (b) Prey and bait constructs were used for Y1H analysis, the mutated bait mP2 is a mutated form P2 by changing ‘GGCGGC’ into ‘GGTGGC’. (c) Growth of yeast cells co‐transformed with the prey and bait on selective medium with or without AbA. Positive control: pGADT7‐Rec‐p53 + p53‐AbAi; Negative control: pGADT7 + bait. (d) EMSA assay using purified His‐PtrERF9 fusion protein incubated with biotin‐labelled probe containing wild‐type or mutated probe, along with or without unlabelled competitor DNA. Open and closed arrows indicate bound and free probes, respectively. +, presence; −, absence. (e) Schematic diagrams of effector and reporter constructs used for dual‐LUC transient assay. (f) The various combinations of vectors were performed on Dual‐LUC transient expression assays in tobacco protoplasts. (g) Representative bioluminescence image of PtrERF9 activation on the PtrACS1 promoter in tobacco leaves. (h) Schematic diagrams of F3 and F4 regions, shown as grey bars, in the PtrACS1 promoter, in which only F3 contains a GCC‐box sequence (black bar). (i) Enrichment of PtrERF9 in the PtrACS1 promoter based on ChIP‐qPCR assays using an anti‐GFP antibody. The arrows below the grey bars in (h) show the specific primers used for ChIP‐qPCR. Error bars indicate ± SE (n = 3). Asterisks indicate that the value is significantly different from that of the control (***P < 0.001).
