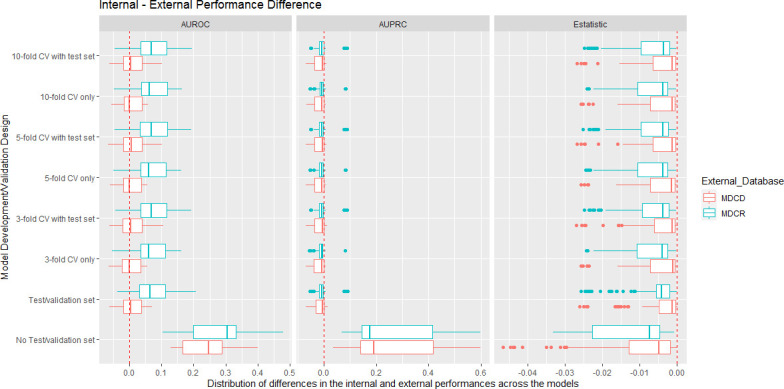
Figure 3.

Box plots showing the internal performance estimate minus the external performance estimate per design and external database. The left side shows the AUROC differences, the centre shows the AUPRC differences, and the right side shows the E-statistic differences. For the AUROC, values near 0 indicate that the internal validation AUROC estimates were accurate as the external validation AUROCs were similar. For AUPRC and AUPRC values less than 0 indicate that the performance was better externally, values greater than 0 indicate the performance is worse externally. For the E-statistic, values less than 0 indicate worse calibration when the models were externally validated. AUPRC, area under the precision recall curve; AUROC, area under the receiver operating curve; CV, cross-validation; MDCD, Multi-state Medicaid Database; MDCR, Medicare Supplemental Database.
