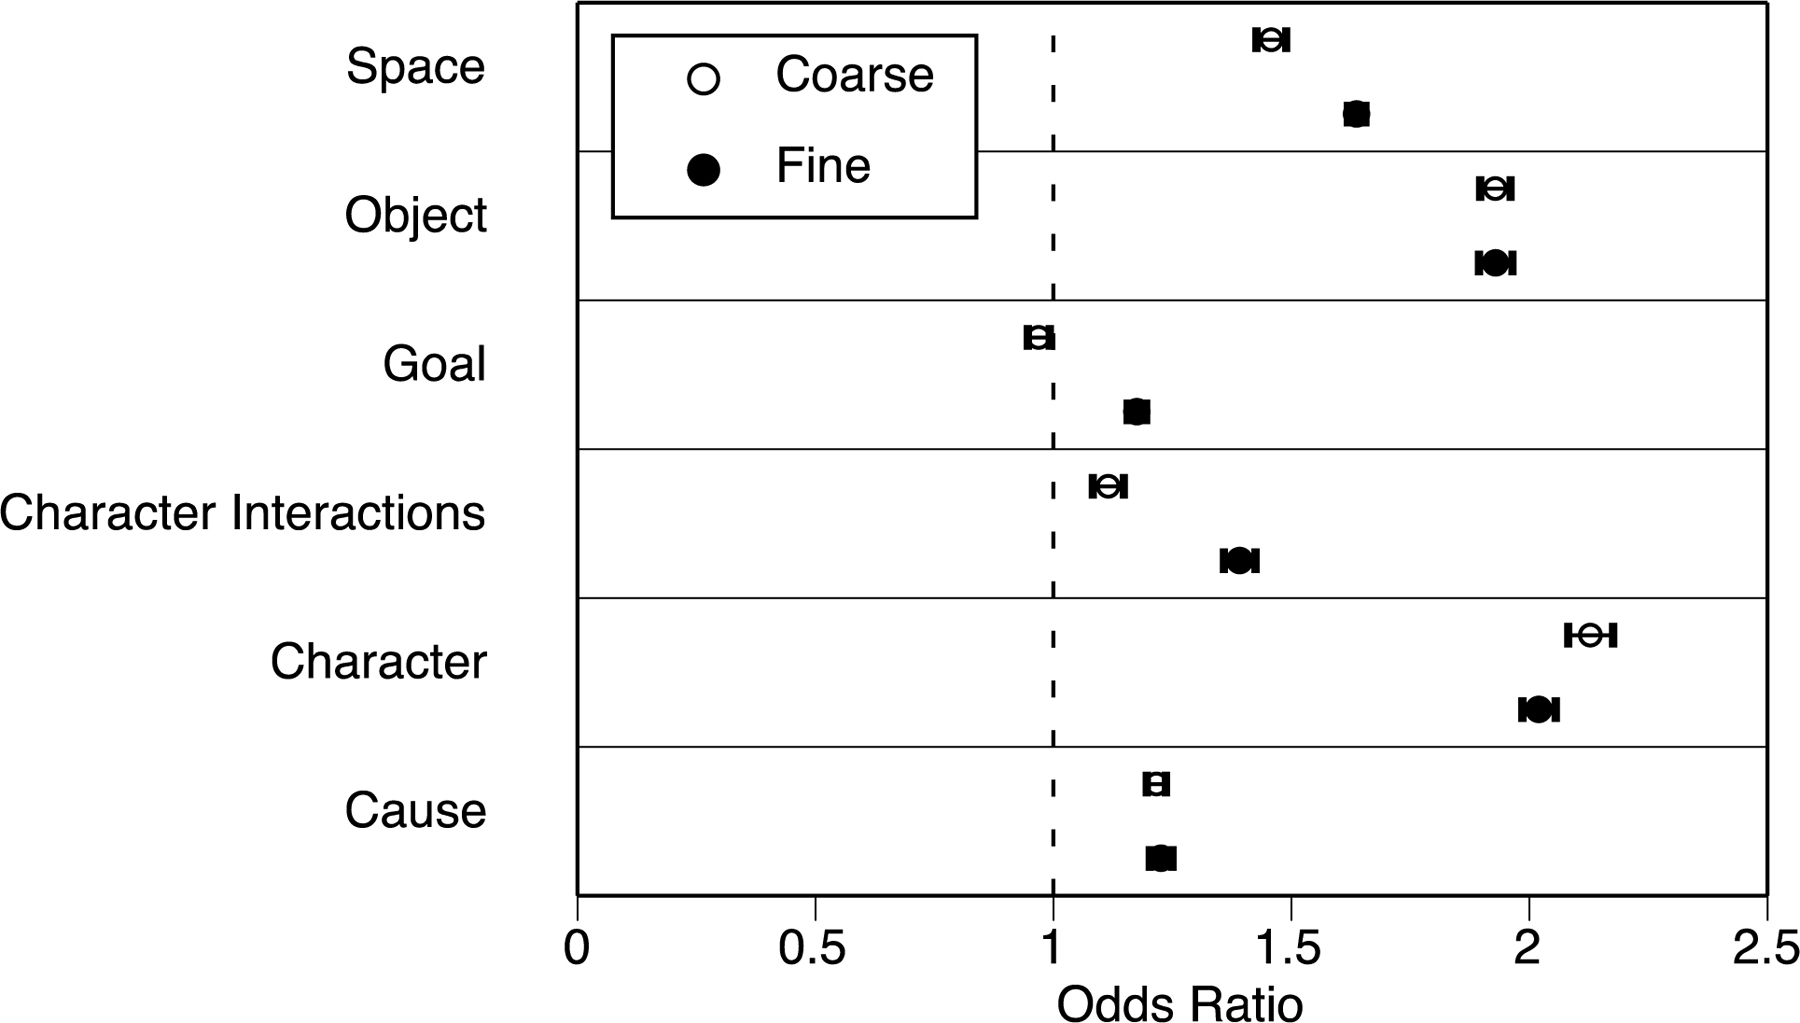
Figure 6.

The relations between situation changes and segmentation in narrative film. Circles represent the odds ratios for the mean coefficients in the logistic regressions, and error bars represent the 95% confidence intervals for these odds ratios. Values whose confidence intervals do not include 1.0 (dashed lines) indicate a statistically significant relationship between changes on that dimension and segmentation.
