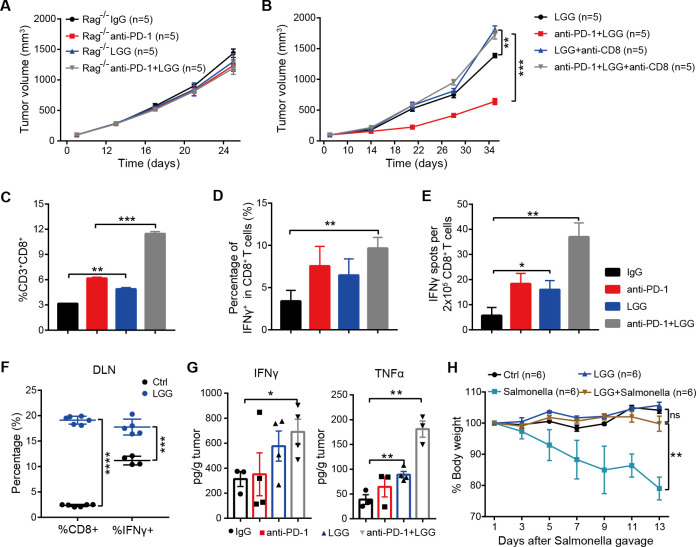
Figure 3.
Combination treatment with Lactobacillus rhamnosus GG (LGG) and anti-programmedcell death 1 (PD-1) antibody promotes activation of cytotoxic CD8+ T cells. (A) Rag1 −/− mice were subcutaneously inoculated with MC38 cells and treated with either IgG control antibody, anti-PD-1 antibody, oral administration of LGG (2×10⁹ CFU) or combination of LGG and anti-PD-1 antibody (n=5). (B) C57BL/6 mice were subcutaneously inoculated with MC38 cells and treated with the combination of LGG and anti-PD-1 antibody (n=5). Two hundred micrograms of anti-CD8 antibody was administered intraperitoneally (i.p.) 24 hours before other treatments. (A and B) Data are presented as mean±SEM. Tumour volume results were analysed by using two-way analysisof variance (ANOVA); **p<0.01; ***p<0.001. (C) Representative flow cytometry analysis and quantification of CD8+ T cells (CD45+CD3+CD8+) in MC38 tumours on day 28 with different treatments as indicated (n=3). (D) Representative flow cytometry analysis and quantification of cytolytic CD8+ T cells (CD45+CD3+CD8+IFN-γ+) in MC38 tumours on day 28 with the indicated treatment (n=3). (E) Interferon (IFN)-γ production in CD8+ T cells. MC38 tumours in wild type (WT) mice given the indicated treatment were removed on day 28. Tumours were digested to purify the CD8+ T cells. Purified CD8+ T cells were restimulated with 1 µg/ mL SIINFEKEL for 48 hours and then analysed by IFN-γ ELISPOT assay. (F) Representative flow cytometry analysis and quantification of CD8+ T cells (CD45+CD3+CD8+) and cytolytic CD8+ T cells (CD45+CD3+CD8+IFN-γ+) in tumour draining lymph nodes of the mice treated with LGG (n=4–6). (G) The levels of IFN-γ and tumour necrosis factor (TNF)-α in MC38 tumours after different treatments. MC38 tumours in WT mice given the indicated treatment were removed on day 28. The levels of IFN-γ and TNF-α in tumours were measured using the LEGENDplex cytokine kit. (C, D, E, F and G) Data are means±SEM; unpaired two-tailed Student’s t-tests; *p<0.05; **p<0.01; ***p<0.001; ****p<0.0001. (H) Body weight change after Salmonella challenge. The WT mice were orally administered LGG (2×10⁹ CFU) prior to oral infection with Salmonella (5×10⁶ CFU). The body weight of mice was measured every 2 days. The percent weight change over the course of Salmonella infection is shown. Data are expressed as mean±SEM and were analysed by using two-way ANOVA; **p<0.01; ns p>0.05. DLN, draining lymph nodes.

