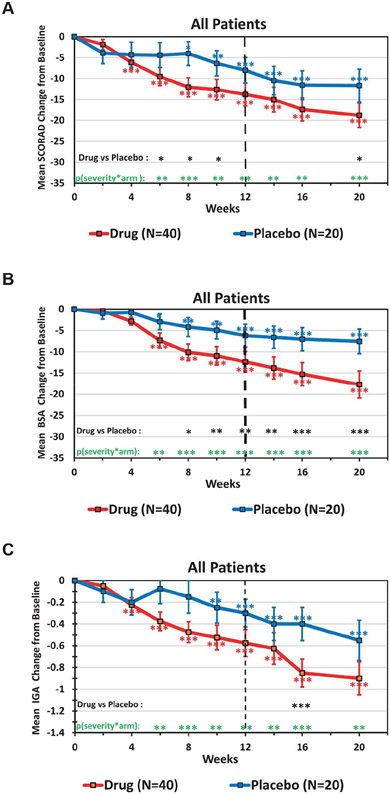
Figure 2. Time course of efficacy variables in the entire study population.
Clinical responses for SCORAD (A), BSA (B), and IGA (C) are shown for the fezakinumab (red) and placebo (blue) arms. All panels depict the mean ±SEM change from baseline. Data was analyzed by MMRM: red and blue asterisks by each curve indicate significant change from baseline for each arm (*p<0·05, **p<0·01, ***p<0·001); black asterisks at the bottom indicate significant differences between drug and placebo arm; green asterisks indicate the significance of the combined factor: baseline severity and treatment arm.

