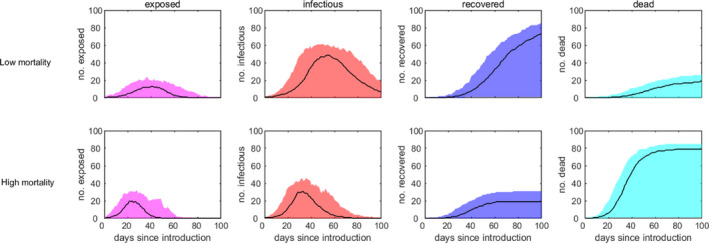
Figure 3.

- The plots show the median (solid line) and 95% prediction interval (shading) for the number of exposed animals (first column; magenta), infectious animals (second column; red), recovered animals (third column; blue) and cumulative number of dead animals (fourth column; cyan) for four scenarios under different mortality rates in a flock of 100 animals (rows; see Table 2 for details).
