Fig. 2.
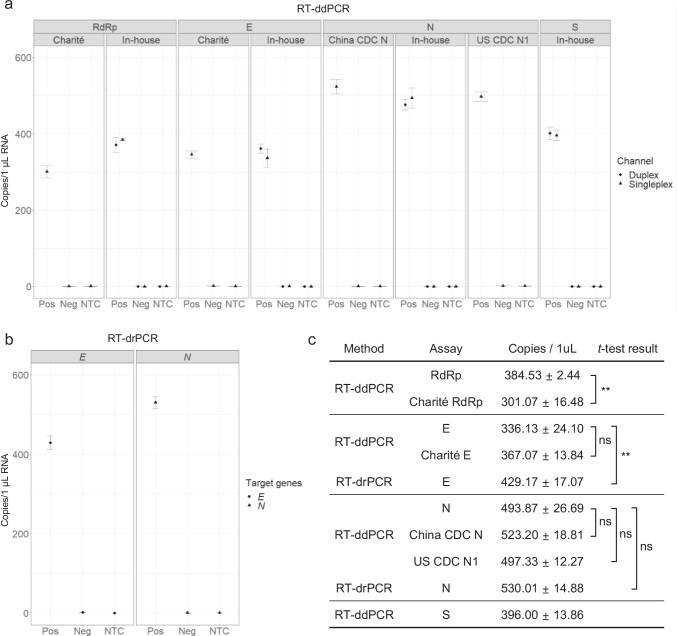
Digital PCR results of RM copy number concentration using assays targeting RdRp, E, N, and S genes. a Representative reverse transcription droplet digital PCR (RT-ddPCR) results showing the concentration of the positive RM and negative RM using indicated in-house and WHO assays. In the case of the in-house assays, a singleplex assay (triangles) and a duplex assay (circles) are tested and compared. No singleplex or duplex t-test results of the same assay are significant. b Results of reverse transcription digital real-time PCR (RT-drPCR). Error bars indicate the standard deviation (SD) at each data point with the mean of replicated measurements (n ≥ 3). Pos, positive RM; Neg, negative RM; NTC, no template control. c Table showing the concentration of 1 μL RNA extracted from the RM and t-test results using singleplex data. The asterisks indicate significant differences analyzed by t-test (*p < 0.05, **p < 0.01, ***p < 0.001), and ns indicates not significant

