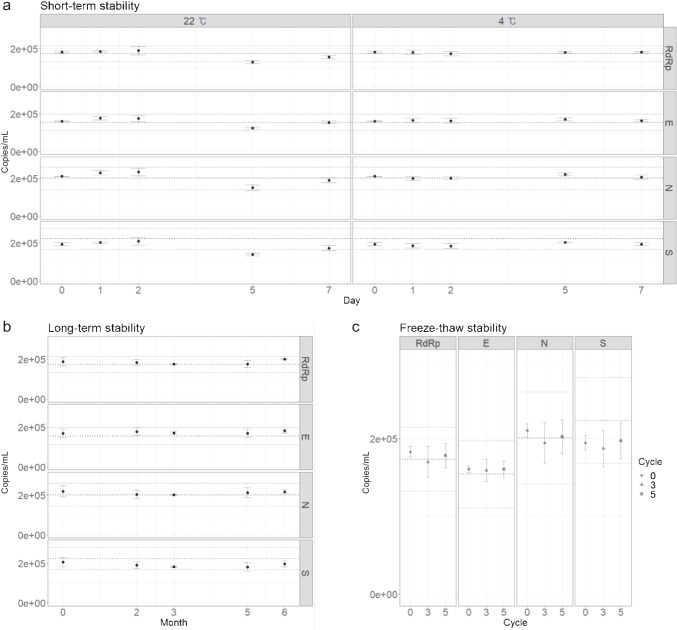
Fig. 4.
Analysis of the stability tests. The concentrations of the RdRp, E, N, and S genes were measured. a Graph showing the copy number concentration of the RM stored for the indicated number of days at 4 °C and 22 °C. b Graph showing the long-term stability test results for 6 months at − 70 °C. c Stability test results following 3 and 5 freeze and thaw cycles. Error bars indicate the SD at each data point with the mean of the replicated measurements (n ≥ 3). The thick dotted lines in the middle of the plots indicate the reference values of the RMs, and the upper and lower thin dotted lines indicate the expanded uncertainty of the RMs

