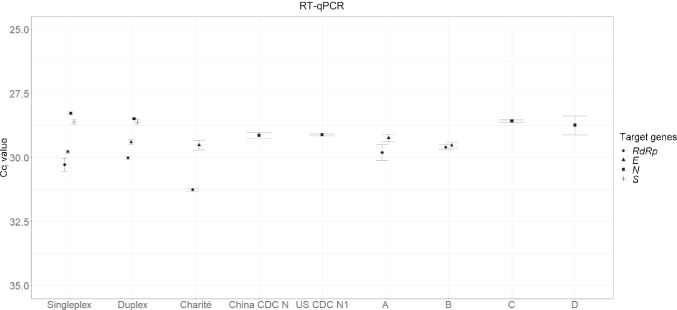
Fig. 6.
Results of reverse transcription quantitative PCR (RT-qPCR) using diagnostic kits and WHO assays. The graph plots the Cq values of the positive RM from in-house assays, WHO assays, and four commercial diagnostic kits (A–D). The Cq values of the RdRp (circles), E (triangles), N (squares), and S (crosses) genes were measured. Error bars indicate the standard deviation (SD) at each data point with the mean of the replicated measurements (n ≥ 3)

