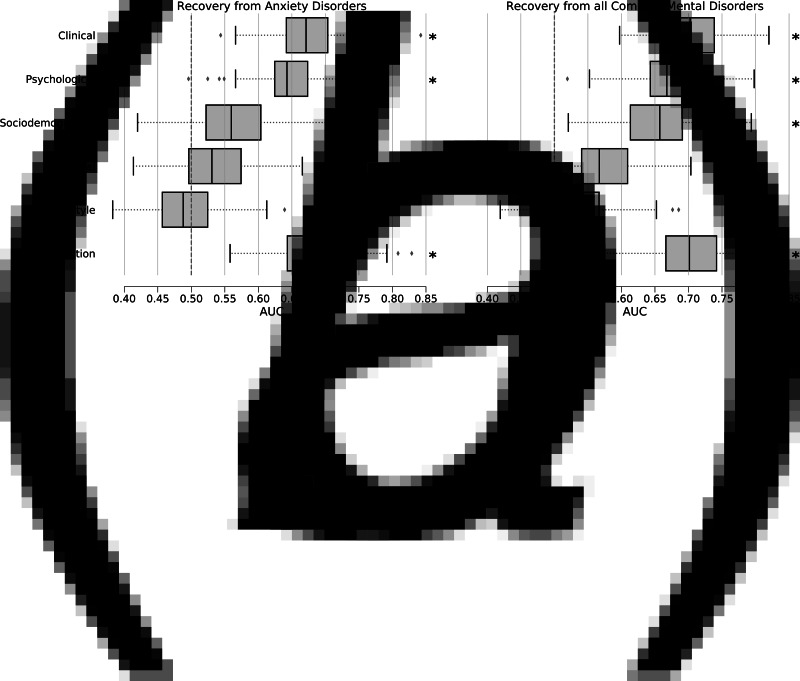
Fig. 1.
Classification performance of random forest classifiers. Performance is quantified by area-under-the-receiver-operator-curve (AUC) values calculated for each test set of all cross-validation iterations and is shown in box-and-whisker plots for all data domains. (a) Performance of the recovery from anxiety disorders prediction,(b) Performance of the recovery from all common mental disorders prediction. Asterisks mark a significant classification performance according to label-permutation tests (n = 1000) and Bonferroni-correction for six tests.The dashed line indicates chance-level performance.

