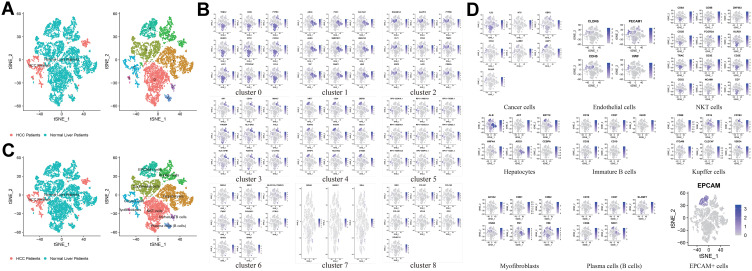
Figure 5.
Identification of 9 cell clusters in the GSE124395 dataset. (A) Cluster map of TSNE cells (normal and patient samples), the cells in cluster 5 were all derived from the HCC patients. (B) TSNE distribution of cluster0 to cluster8 marker genes. (C) Clustering map of cells after naming (differentiating normal and patients). (D) The figure above shows the distribution of marker genes of each subgroup in each cluster in the CellMarker database.

