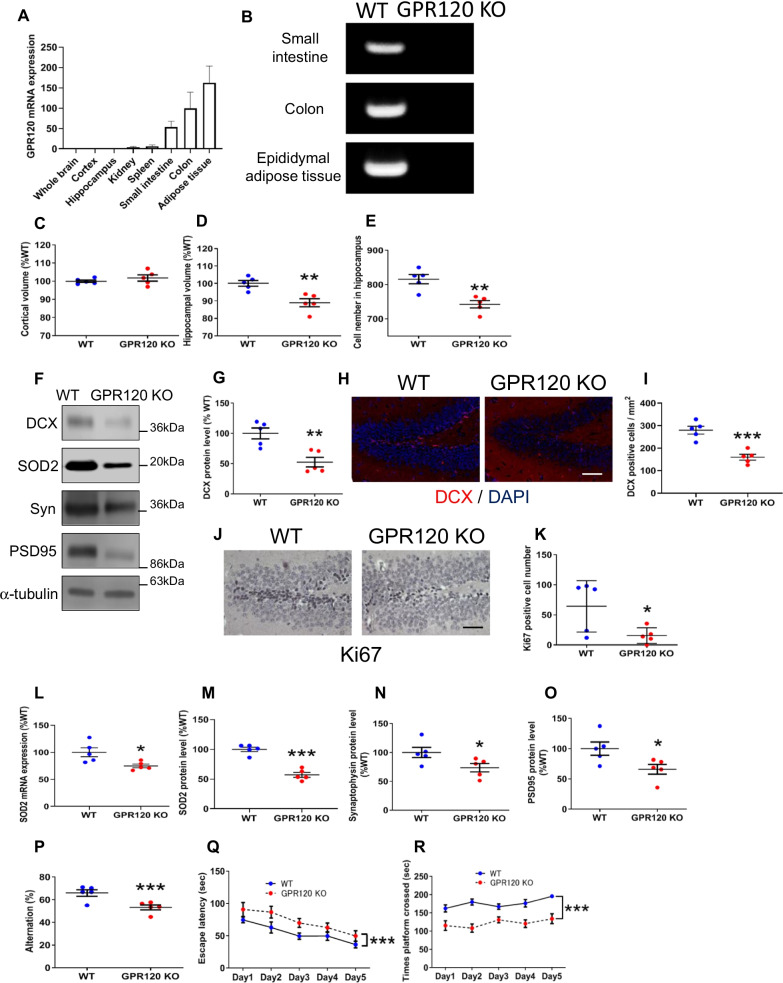
Fig. 1.
Declines in hippocampal volume, neurogenesis, and cognitive function observed in GPR120 KO mice. The level of GPR120 mRNA (A) relative to PGK1 in WT mice tissues, as determined by real-time PCR. Genotyping of GPR120 gene in small intestine, colon, and epididymal adipose tissue (B). Cortical (C) and Hippocampal (D) volumes of WT and GPR120 KO mice. Nissl staining and pyramidal cell counts of hippocampus (E). Scale bar = 80 μm. The protein level determined by western blot analysis (F). The protein level of DCX in the hippocampus (G). The immunofluorescence of DCX (H) and DCX-positive cell count in the dentate gyrus (I). Scale bar = 80 μm. Ki67 staining (J) and the number of Ki67-positive nuclei in the dentate gyrus (K). Scale bar = 80 μm. The level of SOD2 mRNA (L) and protein (M) expression in the hippocampus. The level of synaptophysin (Syn) (N) and PSD95 (O) protein in the hippocampus. Learning and memory performance were evaluated using the Y-maze (P). Data are presented as the mean ± SEM, n = 5 per group. Statistical analysis was performed using a student’s t test (*p < 0.05; **p < 0.01; ***p < 0.001 vs. WT). Morris water maze test: Escape latency (Q) and Time platform crossed (R). Data are mean ± SEM, n = 10 per group. Statistical analysis was performed using two-way ANOVA followed by post-hoc Tukey test (***p < 0.001 vs. WT)

